matrixStats.benchmarks
varDiff() benchmarks on subsetted computation
This report benchmark the performance of varDiff() on subsetted computation.
Data type “integer”
Data
> rvector <- function(n, mode = c("logical", "double", "integer"), range = c(-100, +100), na_prob = 0) {
+     mode <- match.arg(mode)
+     if (mode == "logical") {
+         x <- sample(c(FALSE, TRUE), size = n, replace = TRUE)
+     }     else {
+         x <- runif(n, min = range[1], max = range[2])
+     }
+     storage.mode(x) <- mode
+     if (na_prob > 0)
+         x[sample(n, size = na_prob * n)] <- NA
+     x
+ }
> rvectors <- function(scale = 10, seed = 1, ...) {
+     set.seed(seed)
+     data <- list()
+     data[[1]] <- rvector(n = scale * 100, ...)
+     data[[2]] <- rvector(n = scale * 1000, ...)
+     data[[3]] <- rvector(n = scale * 10000, ...)
+     data[[4]] <- rvector(n = scale * 1e+05, ...)
+     data[[5]] <- rvector(n = scale * 1e+06, ...)
+     names(data) <- sprintf("n = %d", sapply(data, FUN = length))
+     data
+ }
> data <- rvectors(mode = mode)
> data <- data[1:4]
Results
n = 1000 vector
All elements
> x <- data[["n = 1000"]]
> idxs <- sample.int(length(x), size = length(x) * 0.7)
> x_S <- x[idxs]
> gc()
           used  (Mb) gc trigger  (Mb)  max used  (Mb)
Ncells  5360195 286.3    8529671 455.6   8529671 455.6
Vcells 11132560  85.0   39910282 304.5 101881463 777.3
> stats <- microbenchmark(varDiff_x_S = varDiff(x_S), `varDiff(x, idxs)` = varDiff(x, idxs = idxs),
+     `varDiff(x[idxs])` = varDiff(x[idxs]), unit = "ms")
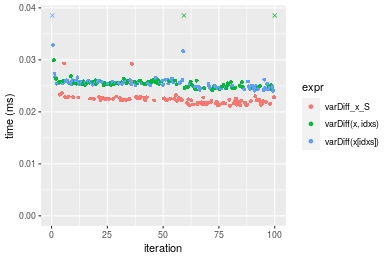
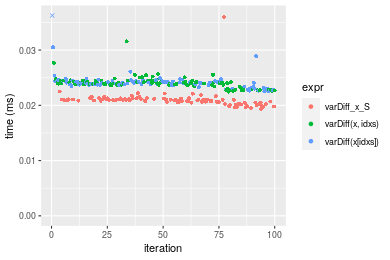
Table: Benchmarking of varDiff_x_S(), varDiff(x, idxs)() and varDiff(x[idxs])() on integer+n = 1000 data. The top panel shows times in milliseconds and the bottom panel shows relative times.
| expr | min | lq | mean | median | uq | max | |
|---|---|---|---|---|---|---|---|
| 1 | varDiff_x_S | 0.021195 | 0.0216705 | 0.0223514 | 0.0222575 | 0.0226140 | 0.029313 |
| 2 | varDiff(x, idxs) | 0.024138 | 0.0249810 | 0.0257170 | 0.0254810 | 0.0258235 | 0.040524 |
| 3 | varDiff(x[idxs]) | 0.024051 | 0.0249505 | 0.0282646 | 0.0255330 | 0.0259245 | 0.296136 |
| expr | min | lq | mean | median | uq | max | |
|---|---|---|---|---|---|---|---|
| 1 | varDiff_x_S | 1.000000 | 1.000000 | 1.000000 | 1.000000 | 1.000000 | 1.000000 |
| 2 | varDiff(x, idxs) | 1.138853 | 1.152765 | 1.150578 | 1.144828 | 1.141925 | 1.382458 |
| 3 | varDiff(x[idxs]) | 1.134749 | 1.151358 | 1.264559 | 1.147164 | 1.146392 | 10.102548 |
Figure: Benchmarking of varDiff_x_S(), varDiff(x, idxs)() and varDiff(x[idxs])() on integer+n = 1000 data. Outliers are displayed as crosses. Times are in milliseconds.
n = 10000 vector
All elements
> x <- data[["n = 10000"]]
> idxs <- sample.int(length(x), size = length(x) * 0.7)
> x_S <- x[idxs]
> gc()
           used  (Mb) gc trigger  (Mb)  max used  (Mb)
Ncells  5347859 285.7    8529671 455.6   8529671 455.6
Vcells 10847039  82.8   39910282 304.5 101881463 777.3
> stats <- microbenchmark(varDiff_x_S = varDiff(x_S), `varDiff(x, idxs)` = varDiff(x, idxs = idxs),
+     `varDiff(x[idxs])` = varDiff(x[idxs]), unit = "ms")
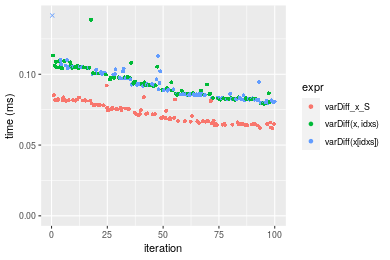
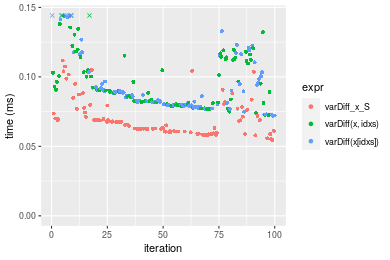
Table: Benchmarking of varDiff_x_S(), varDiff(x, idxs)() and varDiff(x[idxs])() on integer+n = 10000 data. The top panel shows times in milliseconds and the bottom panel shows relative times.
| expr | min | lq | mean | median | uq | max | |
|---|---|---|---|---|---|---|---|
| 1 | varDiff_x_S | 0.061708 | 0.0657500 | 0.0724005 | 0.071702 | 0.0783725 | 0.092092 |
| 3 | varDiff(x[idxs]) | 0.079291 | 0.0834265 | 0.0923500 | 0.088973 | 0.1004415 | 0.172308 |
| 2 | varDiff(x, idxs) | 0.079106 | 0.0830625 | 0.0928867 | 0.092162 | 0.1006460 | 0.138589 |
| expr | min | lq | mean | median | uq | max | |
|---|---|---|---|---|---|---|---|
| 1 | varDiff_x_S | 1.000000 | 1.000000 | 1.000000 | 1.000000 | 1.000000 | 1.000000 |
| 3 | varDiff(x[idxs]) | 1.284939 | 1.268844 | 1.275544 | 1.240872 | 1.281591 | 1.871042 |
| 2 | varDiff(x, idxs) | 1.281941 | 1.263308 | 1.282957 | 1.285348 | 1.284201 | 1.504897 |
Figure: Benchmarking of varDiff_x_S(), varDiff(x, idxs)() and varDiff(x[idxs])() on integer+n = 10000 data. Outliers are displayed as crosses. Times are in milliseconds.
n = 100000 vector
All elements
> x <- data[["n = 100000"]]
> idxs <- sample.int(length(x), size = length(x) * 0.7)
> x_S <- x[idxs]
> gc()
           used  (Mb) gc trigger  (Mb)  max used  (Mb)
Ncells  5347931 285.7    8529671 455.6   8529671 455.6
Vcells 10910599  83.3   39910282 304.5 101881463 777.3
> stats <- microbenchmark(varDiff_x_S = varDiff(x_S), `varDiff(x, idxs)` = varDiff(x, idxs = idxs),
+     `varDiff(x[idxs])` = varDiff(x[idxs]), unit = "ms")
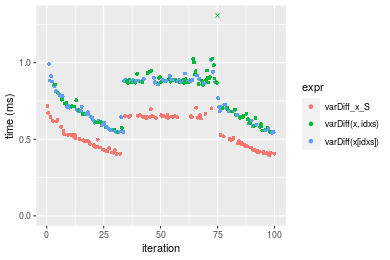
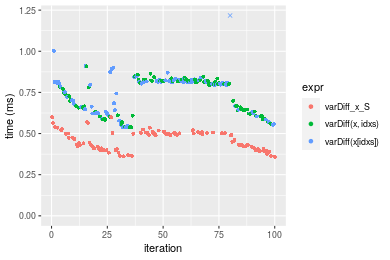
Table: Benchmarking of varDiff_x_S(), varDiff(x, idxs)() and varDiff(x[idxs])() on integer+n = 100000 data. The top panel shows times in milliseconds and the bottom panel shows relative times.
| expr | min | lq | mean | median | uq | max | |
|---|---|---|---|---|---|---|---|
| 1 | varDiff_x_S | 0.396543 | 0.450572 | 0.5418317 | 0.5178700 | 0.6463175 | 0.717701 |
| 3 | varDiff(x[idxs]) | 0.541489 | 0.624128 | 0.7528008 | 0.7270815 | 0.8794145 | 1.018039 |
| 2 | varDiff(x, idxs) | 0.547256 | 0.643773 | 0.8377526 | 0.8585710 | 0.8841555 | 6.993578 |
| expr | min | lq | mean | median | uq | max | |
|---|---|---|---|---|---|---|---|
| 1 | varDiff_x_S | 1.000000 | 1.000000 | 1.000000 | 1.000000 | 1.000000 | 1.000000 |
| 3 | varDiff(x[idxs]) | 1.365524 | 1.385190 | 1.389363 | 1.403985 | 1.360654 | 1.418472 |
| 2 | varDiff(x, idxs) | 1.380067 | 1.428791 | 1.546149 | 1.657889 | 1.367989 | 9.744417 |
Figure: Benchmarking of varDiff_x_S(), varDiff(x, idxs)() and varDiff(x[idxs])() on integer+n = 100000 data. Outliers are displayed as crosses. Times are in milliseconds.
n = 1000000 vector
All elements
> x <- data[["n = 1000000"]]
> idxs <- sample.int(length(x), size = length(x) * 0.7)
> x_S <- x[idxs]
> gc()
           used  (Mb) gc trigger  (Mb)  max used  (Mb)
Ncells  5348003 285.7    8529671 455.6   8529671 455.6
Vcells 11540648  88.1   39910282 304.5 101881463 777.3
> stats <- microbenchmark(varDiff_x_S = varDiff(x_S), `varDiff(x, idxs)` = varDiff(x, idxs = idxs),
+     `varDiff(x[idxs])` = varDiff(x[idxs]), unit = "ms")
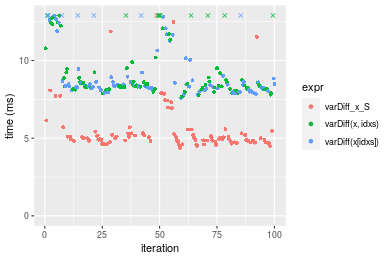
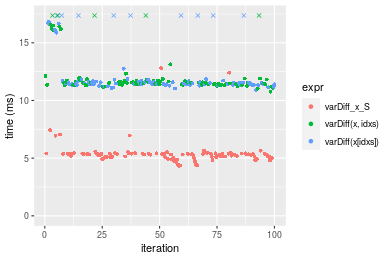
Table: Benchmarking of varDiff_x_S(), varDiff(x, idxs)() and varDiff(x[idxs])() on integer+n = 1000000 data. The top panel shows times in milliseconds and the bottom panel shows relative times.
| expr | min | lq | mean | median | uq | max | |
|---|---|---|---|---|---|---|---|
| 1 | varDiff_x_S | 4.379420 | 4.783583 | 9.364553 | 5.003983 | 5.314272 | 395.28087 |
| 3 | varDiff(x[idxs]) | 7.603857 | 8.113601 | 9.238030 | 8.345719 | 8.881355 | 17.70021 |
| 2 | varDiff(x, idxs) | 7.674196 | 8.216176 | 9.504877 | 8.394405 | 9.497711 | 16.08516 |
| expr | min | lq | mean | median | uq | max | |
|---|---|---|---|---|---|---|---|
| 1 | varDiff_x_S | 1.000000 | 1.000000 | 1.0000000 | 1.000000 | 1.000000 | 1.0000000 |
| 3 | varDiff(x[idxs]) | 1.736270 | 1.696135 | 0.9864891 | 1.667815 | 1.671227 | 0.0447788 |
| 2 | varDiff(x, idxs) | 1.752332 | 1.717577 | 1.0149846 | 1.677545 | 1.787209 | 0.0406930 |
Figure: Benchmarking of varDiff_x_S(), varDiff(x, idxs)() and varDiff(x[idxs])() on integer+n = 1000000 data. Outliers are displayed as crosses. Times are in milliseconds.
Data type “double”
Data
> rvector <- function(n, mode = c("logical", "double", "integer"), range = c(-100, +100), na_prob = 0) {
+     mode <- match.arg(mode)
+     if (mode == "logical") {
+         x <- sample(c(FALSE, TRUE), size = n, replace = TRUE)
+     }     else {
+         x <- runif(n, min = range[1], max = range[2])
+     }
+     storage.mode(x) <- mode
+     if (na_prob > 0)
+         x[sample(n, size = na_prob * n)] <- NA
+     x
+ }
> rvectors <- function(scale = 10, seed = 1, ...) {
+     set.seed(seed)
+     data <- list()
+     data[[1]] <- rvector(n = scale * 100, ...)
+     data[[2]] <- rvector(n = scale * 1000, ...)
+     data[[3]] <- rvector(n = scale * 10000, ...)
+     data[[4]] <- rvector(n = scale * 1e+05, ...)
+     data[[5]] <- rvector(n = scale * 1e+06, ...)
+     names(data) <- sprintf("n = %d", sapply(data, FUN = length))
+     data
+ }
> data <- rvectors(mode = mode)
> data <- data[1:4]
Results
n = 1000 vector
All elements
> x <- data[["n = 1000"]]
> idxs <- sample.int(length(x), size = length(x) * 0.7)
> x_S <- x[idxs]
> gc()
           used  (Mb) gc trigger  (Mb)  max used  (Mb)
Ncells  5348084 285.7    8529671 455.6   8529671 455.6
Vcells 11397468  87.0   39910282 304.5 101881463 777.3
> stats <- microbenchmark(varDiff_x_S = varDiff(x_S), `varDiff(x, idxs)` = varDiff(x, idxs = idxs),
+     `varDiff(x[idxs])` = varDiff(x[idxs]), unit = "ms")
Table: Benchmarking of varDiff_x_S(), varDiff(x, idxs)() and varDiff(x[idxs])() on double+n = 1000 data. The top panel shows times in milliseconds and the bottom panel shows relative times.
| expr | min | lq | mean | median | uq | max | |
|---|---|---|---|---|---|---|---|
| 1 | varDiff_x_S | 0.019359 | 0.020487 | 0.0209542 | 0.0208770 | 0.0211265 | 0.035979 |
| 2 | varDiff(x, idxs) | 0.022467 | 0.023722 | 0.0240613 | 0.0240090 | 0.0243715 | 0.031585 |
| 3 | varDiff(x[idxs]) | 0.022488 | 0.023675 | 0.0245888 | 0.0240485 | 0.0243320 | 0.080856 |
| expr | min | lq | mean | median | uq | max | |
|---|---|---|---|---|---|---|---|
| 1 | varDiff_x_S | 1.000000 | 1.000000 | 1.000000 | 1.000000 | 1.000000 | 1.0000000 |
| 2 | varDiff(x, idxs) | 1.160546 | 1.157905 | 1.148281 | 1.150022 | 1.153599 | 0.8778732 |
| 3 | varDiff(x[idxs]) | 1.161630 | 1.155611 | 1.173456 | 1.151914 | 1.151729 | 2.2473109 |
Figure: Benchmarking of varDiff_x_S(), varDiff(x, idxs)() and varDiff(x[idxs])() on double+n = 1000 data. Outliers are displayed as crosses. Times are in milliseconds.
n = 10000 vector
All elements
> x <- data[["n = 10000"]]
> idxs <- sample.int(length(x), size = length(x) * 0.7)
> x_S <- x[idxs]
> gc()
           used  (Mb) gc trigger  (Mb)  max used  (Mb)
Ncells  5348147 285.7    8529671 455.6   8529671 455.6
Vcells 11407204  87.1   39910282 304.5 101881463 777.3
> stats <- microbenchmark(varDiff_x_S = varDiff(x_S), `varDiff(x, idxs)` = varDiff(x, idxs = idxs),
+     `varDiff(x[idxs])` = varDiff(x[idxs]), unit = "ms")
Table: Benchmarking of varDiff_x_S(), varDiff(x, idxs)() and varDiff(x[idxs])() on double+n = 10000 data. The top panel shows times in milliseconds and the bottom panel shows relative times.
| expr | min | lq | mean | median | uq | max | |
|---|---|---|---|---|---|---|---|
| 1 | varDiff_x_S | 0.054517 | 0.0606525 | 0.0700170 | 0.0673795 | 0.0740475 | 0.111827 |
| 3 | varDiff(x[idxs]) | 0.071929 | 0.0796925 | 0.0937592 | 0.0858950 | 0.0975415 | 0.164889 |
| 2 | varDiff(x, idxs) | 0.072381 | 0.0811230 | 0.0966786 | 0.0895080 | 0.1124140 | 0.155331 |
| expr | min | lq | mean | median | uq | max | |
|---|---|---|---|---|---|---|---|
| 1 | varDiff_x_S | 1.000000 | 1.000000 | 1.000000 | 1.000000 | 1.000000 | 1.000000 |
| 3 | varDiff(x[idxs]) | 1.319387 | 1.313919 | 1.339091 | 1.274794 | 1.317283 | 1.474501 |
| 2 | varDiff(x, idxs) | 1.327678 | 1.337505 | 1.380786 | 1.328416 | 1.518134 | 1.389029 |
Figure: Benchmarking of varDiff_x_S(), varDiff(x, idxs)() and varDiff(x[idxs])() on double+n = 10000 data. Outliers are displayed as crosses. Times are in milliseconds.
n = 100000 vector
All elements
> x <- data[["n = 100000"]]
> idxs <- sample.int(length(x), size = length(x) * 0.7)
> x_S <- x[idxs]
> gc()
           used  (Mb) gc trigger  (Mb)  max used  (Mb)
Ncells  5348219 285.7    8529671 455.6   8529671 455.6
Vcells 11502057  87.8   39910282 304.5 101881463 777.3
> stats <- microbenchmark(varDiff_x_S = varDiff(x_S), `varDiff(x, idxs)` = varDiff(x, idxs = idxs),
+     `varDiff(x[idxs])` = varDiff(x[idxs]), unit = "ms")
Table: Benchmarking of varDiff_x_S(), varDiff(x, idxs)() and varDiff(x[idxs])() on double+n = 100000 data. The top panel shows times in milliseconds and the bottom panel shows relative times.
| expr | min | lq | mean | median | uq | max | |
|---|---|---|---|---|---|---|---|
| 1 | varDiff_x_S | 0.358198 | 0.4097210 | 0.4616626 | 0.4741120 | 0.5029425 | 0.600111 |
| 2 | varDiff(x, idxs) | 0.537136 | 0.6279275 | 0.7293970 | 0.7947905 | 0.8206770 | 0.908008 |
| 3 | varDiff(x[idxs]) | 0.537496 | 0.6326595 | 0.8638420 | 0.7986575 | 0.8177885 | 13.153771 |
| expr | min | lq | mean | median | uq | max | |
|---|---|---|---|---|---|---|---|
| 1 | varDiff_x_S | 1.000000 | 1.000000 | 1.000000 | 1.000000 | 1.000000 | 1.000000 |
| 2 | varDiff(x, idxs) | 1.499551 | 1.532573 | 1.579935 | 1.676377 | 1.631751 | 1.513067 |
| 3 | varDiff(x[idxs]) | 1.500556 | 1.544123 | 1.871154 | 1.684533 | 1.626008 | 21.918897 |
Figure: Benchmarking of varDiff_x_S(), varDiff(x, idxs)() and varDiff(x[idxs])() on double+n = 100000 data. Outliers are displayed as crosses. Times are in milliseconds.
n = 1000000 vector
All elements
> x <- data[["n = 1000000"]]
> idxs <- sample.int(length(x), size = length(x) * 0.7)
> x_S <- x[idxs]
> gc()
           used  (Mb) gc trigger  (Mb)  max used  (Mb)
Ncells  5348291 285.7    8529671 455.6   8529671 455.6
Vcells 12447467  95.0   39910282 304.5 101881463 777.3
> stats <- microbenchmark(varDiff_x_S = varDiff(x_S), `varDiff(x, idxs)` = varDiff(x, idxs = idxs),
+     `varDiff(x[idxs])` = varDiff(x[idxs]), unit = "ms")
Table: Benchmarking of varDiff_x_S(), varDiff(x, idxs)() and varDiff(x[idxs])() on double+n = 1000000 data. The top panel shows times in milliseconds and the bottom panel shows relative times.
| expr | min | lq | mean | median | uq | max | |
|---|---|---|---|---|---|---|---|
| 1 | varDiff_x_S | 4.340057 | 5.081025 | 5.406844 | 5.317157 | 5.389139 | 12.80499 |
| 3 | varDiff(x[idxs]) | 10.918183 | 11.390210 | 12.467142 | 11.500198 | 11.679688 | 21.25210 |
| 2 | varDiff(x, idxs) | 10.756500 | 11.382810 | 12.213423 | 11.511443 | 11.715889 | 21.98133 |
| expr | min | lq | mean | median | uq | max | |
|---|---|---|---|---|---|---|---|
| 1 | varDiff_x_S | 1.000000 | 1.000000 | 1.000000 | 1.000000 | 1.000000 | 1.000000 |
| 3 | varDiff(x[idxs]) | 2.515677 | 2.241715 | 2.305807 | 2.162847 | 2.167264 | 1.659673 |
| 2 | varDiff(x, idxs) | 2.478424 | 2.240258 | 2.258882 | 2.164962 | 2.173982 | 1.716621 |
Figure: Benchmarking of varDiff_x_S(), varDiff(x, idxs)() and varDiff(x[idxs])() on double+n = 1000000 data. Outliers are displayed as crosses. Times are in milliseconds.
Appendix
Session information
R version 4.1.1 Patched (2021-08-10 r80727)
Platform: x86_64-pc-linux-gnu (64-bit)
Running under: Ubuntu 18.04.5 LTS

Matrix products: default
BLAS:   /home/hb/software/R-devel/R-4-1-branch/lib/R/lib/libRblas.so
LAPACK: /home/hb/software/R-devel/R-4-1-branch/lib/R/lib/libRlapack.so

locale:
 [1] LC_CTYPE=en_US.UTF-8       LC_NUMERIC=C
 [3] LC_TIME=en_US.UTF-8        LC_COLLATE=en_US.UTF-8
 [5] LC_MONETARY=en_US.UTF-8    LC_MESSAGES=en_US.UTF-8
 [7] LC_PAPER=en_US.UTF-8       LC_NAME=C
 [9] LC_ADDRESS=C               LC_TELEPHONE=C
[11] LC_MEASUREMENT=en_US.UTF-8 LC_IDENTIFICATION=C

attached base packages:
[1] stats     graphics  grDevices utils     datasets  methods   base

other attached packages:
[1] microbenchmark_1.4-7   matrixStats_0.60.1     ggplot2_3.3.5
[4] knitr_1.33             R.devices_2.17.0       R.utils_2.10.1
[7] R.oo_1.24.0            R.methodsS3_1.8.1-9001 history_0.0.1-9000

loaded via a namespace (and not attached):
 [1] Biobase_2.52.0          httr_1.4.2              splines_4.1.1
 [4] bit64_4.0.5             network_1.17.1          assertthat_0.2.1
 [7] highr_0.9               stats4_4.1.1            blob_1.2.2
[10] GenomeInfoDbData_1.2.6  robustbase_0.93-8       pillar_1.6.2
[13] RSQLite_2.2.8           lattice_0.20-44         glue_1.4.2
[16] digest_0.6.27           XVector_0.32.0          colorspace_2.0-2
[19] Matrix_1.3-4            XML_3.99-0.7            pkgconfig_2.0.3
[22] zlibbioc_1.38.0         genefilter_1.74.0       purrr_0.3.4
[25] ergm_4.1.2              xtable_1.8-4            scales_1.1.1
[28] tibble_3.1.4            annotate_1.70.0         KEGGREST_1.32.0
[31] farver_2.1.0            generics_0.1.0          IRanges_2.26.0
[34] ellipsis_0.3.2          cachem_1.0.6            withr_2.4.2
[37] BiocGenerics_0.38.0     mime_0.11               survival_3.2-13
[40] magrittr_2.0.1          crayon_1.4.1            statnet.common_4.5.0
[43] memoise_2.0.0           laeken_0.5.1            fansi_0.5.0
[46] R.cache_0.15.0          MASS_7.3-54             R.rsp_0.44.0
[49] progressr_0.8.0         tools_4.1.1             lifecycle_1.0.0
[52] S4Vectors_0.30.0        trust_0.1-8             munsell_0.5.0
[55] tabby_0.0.1-9001        AnnotationDbi_1.54.1    Biostrings_2.60.2
[58] compiler_4.1.1          GenomeInfoDb_1.28.1     rlang_0.4.11
[61] grid_4.1.1              RCurl_1.98-1.4          cwhmisc_6.6
[64] rappdirs_0.3.3          startup_0.15.0          labeling_0.4.2
[67] bitops_1.0-7            base64enc_0.1-3         boot_1.3-28
[70] gtable_0.3.0            DBI_1.1.1               markdown_1.1
[73] R6_2.5.1                lpSolveAPI_5.5.2.0-17.7 rle_0.9.2
[76] dplyr_1.0.7             fastmap_1.1.0           bit_4.0.4
[79] utf8_1.2.2              parallel_4.1.1          Rcpp_1.0.7
[82] vctrs_0.3.8             png_0.1-7               DEoptimR_1.0-9
[85] tidyselect_1.1.1        xfun_0.25               coda_0.19-4
Total processing time was 14.58 secs.
Reproducibility
To reproduce this report, do:
html <- matrixStats:::benchmark('varDiff_subset')
Copyright Dongcan Jiang. Last updated on 2021-08-25 19:31:24 (+0200 UTC). Powered by RSP.