matrixStats.benchmarks
product() benchmarks on subsetted computation
This report benchmark the performance of product() on subsetted computation.
Data
> rvector <- function(n, mode = c("logical", "double", "integer"), range = c(-100, +100), na_prob = 0) {
+     mode <- match.arg(mode)
+     if (mode == "logical") {
+         x <- sample(c(FALSE, TRUE), size = n, replace = TRUE)
+     }     else {
+         x <- runif(n, min = range[1], max = range[2])
+     }
+     storage.mode(x) <- mode
+     if (na_prob > 0)
+         x[sample(n, size = na_prob * n)] <- NA
+     x
+ }
> rvectors <- function(scale = 10, seed = 1, ...) {
+     set.seed(seed)
+     data <- list()
+     data[[1]] <- rvector(n = scale * 100, ...)
+     data[[2]] <- rvector(n = scale * 1000, ...)
+     data[[3]] <- rvector(n = scale * 10000, ...)
+     data[[4]] <- rvector(n = scale * 1e+05, ...)
+     data[[5]] <- rvector(n = scale * 1e+06, ...)
+     names(data) <- sprintf("n = %d", sapply(data, FUN = length))
+     data
+ }
> data <- rvectors(mode = "double")
> data <- data[1:4]
Results
n = 1000 vector
> x <- data[["n = 1000"]]
> idxs <- sample.int(length(x), size = length(x) * 0.7)
> x_S <- x[idxs]
> gc()
           used  (Mb) gc trigger  (Mb)  max used  (Mb)
Ncells  5348348 285.7    8529671 455.6   8529671 455.6
Vcells 26555530 202.7   56123964 428.2 101881463 777.3
> stats <- microbenchmark(product_x_S = product(x_S, na.rm = FALSE), `product(x, idxs)` = product(x,
+     idxs = idxs, na.rm = FALSE), `product(x[idxs])` = product(x[idxs], na.rm = FALSE), unit = "ms")
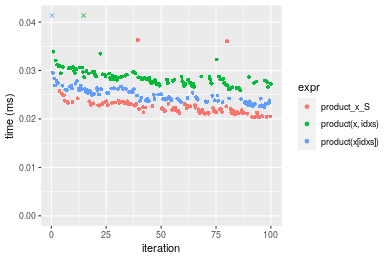
Table: Benchmarking of product_x_S(), product(x, idxs)() and product(x[idxs])() on n = 1000 data. The top panel shows times in milliseconds and the bottom panel shows relative times.
| expr | min | lq | mean | median | uq | max | |
|---|---|---|---|---|---|---|---|
| 1 | product_x_S | 0.020312 | 0.0212930 | 0.0224847 | 0.0220555 | 0.0231145 | 0.036293 |
| 3 | product(x[idxs]) | 0.022358 | 0.0236810 | 0.0251393 | 0.0247970 | 0.0261005 | 0.051534 |
| 2 | product(x, idxs) | 0.025923 | 0.0274065 | 0.0286387 | 0.0282120 | 0.0293720 | 0.043133 |
| expr | min | lq | mean | median | uq | max | |
|---|---|---|---|---|---|---|---|
| 1 | product_x_S | 1.000000 | 1.000000 | 1.000000 | 1.000000 | 1.000000 | 1.000000 |
| 3 | product(x[idxs]) | 1.100729 | 1.112149 | 1.118066 | 1.124300 | 1.129183 | 1.419943 |
| 2 | product(x, idxs) | 1.276241 | 1.287113 | 1.273699 | 1.279137 | 1.270717 | 1.188466 |
Figure: Benchmarking of product_x_S(), product(x, idxs)() and product(x[idxs])() on n = 1000 data. Outliers are displayed as crosses. Times are in milliseconds.
n = 10000 vector
> x <- data[["n = 10000"]]
> idxs <- sample.int(length(x), size = length(x) * 0.7)
> x_S <- x[idxs]
> gc()
           used (Mb) gc trigger  (Mb)  max used  (Mb)
Ncells  5335732  285    8529671 455.6   8529671 455.6
Vcells 11392725   87   44899172 342.6 101881463 777.3
> stats <- microbenchmark(product_x_S = product(x_S, na.rm = FALSE), `product(x, idxs)` = product(x,
+     idxs = idxs, na.rm = FALSE), `product(x[idxs])` = product(x[idxs], na.rm = FALSE), unit = "ms")
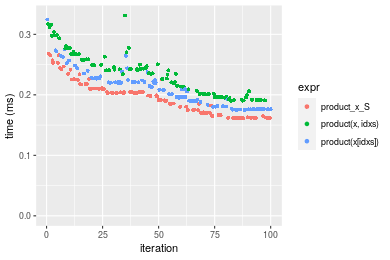
Table: Benchmarking of product_x_S(), product(x, idxs)() and product(x[idxs])() on n = 10000 data. The top panel shows times in milliseconds and the bottom panel shows relative times.
| expr | min | lq | mean | median | uq | max | |
|---|---|---|---|---|---|---|---|
| 1 | product_x_S | 0.161096 | 0.1698225 | 0.1959074 | 0.1984085 | 0.2099405 | 0.267884 |
| 3 | product(x[idxs]) | 0.175005 | 0.1809340 | 0.2097211 | 0.2080095 | 0.2268550 | 0.324637 |
| 2 | product(x, idxs) | 0.190350 | 0.1967330 | 0.2336002 | 0.2350875 | 0.2579695 | 0.331138 |
| expr | min | lq | mean | median | uq | max | |
|---|---|---|---|---|---|---|---|
| 1 | product_x_S | 1.000000 | 1.000000 | 1.000000 | 1.000000 | 1.000000 | 1.000000 |
| 3 | product(x[idxs]) | 1.086340 | 1.065430 | 1.070512 | 1.048390 | 1.080568 | 1.211857 |
| 2 | product(x, idxs) | 1.181594 | 1.158462 | 1.192402 | 1.184866 | 1.228774 | 1.236125 |
Figure: Benchmarking of product_x_S(), product(x, idxs)() and product(x[idxs])() on n = 10000 data. Outliers are displayed as crosses. Times are in milliseconds.
n = 100000 vector
> x <- data[["n = 100000"]]
> idxs <- sample.int(length(x), size = length(x) * 0.7)
> x_S <- x[idxs]
> gc()
           used  (Mb) gc trigger  (Mb)  max used  (Mb)
Ncells  5335804 285.0    8529671 455.6   8529671 455.6
Vcells 11487785  87.7   35919338 274.1 101881463 777.3
> stats <- microbenchmark(product_x_S = product(x_S, na.rm = FALSE), `product(x, idxs)` = product(x,
+     idxs = idxs, na.rm = FALSE), `product(x[idxs])` = product(x[idxs], na.rm = FALSE), unit = "ms")
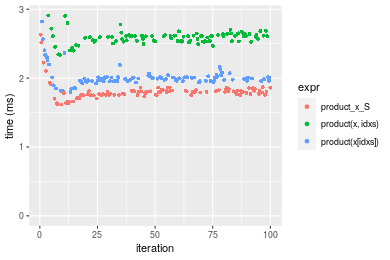
Table: Benchmarking of product_x_S(), product(x, idxs)() and product(x[idxs])() on n = 100000 data. The top panel shows times in milliseconds and the bottom panel shows relative times.
| expr | min | lq | mean | median | uq | max | |
|---|---|---|---|---|---|---|---|
| 1 | product_x_S | 1.616312 | 1.754805 | 1.805520 | 1.800196 | 1.818434 | 2.630223 |
| 3 | product(x[idxs]) | 1.796889 | 1.957134 | 2.013671 | 1.992230 | 2.012831 | 2.822592 |
| 2 | product(x, idxs) | 2.339615 | 2.534635 | 2.582890 | 2.599193 | 2.617241 | 2.909626 |
| expr | min | lq | mean | median | uq | max | |
|---|---|---|---|---|---|---|---|
| 1 | product_x_S | 1.000000 | 1.000000 | 1.000000 | 1.000000 | 1.000000 | 1.000000 |
| 3 | product(x[idxs]) | 1.111722 | 1.115300 | 1.115286 | 1.106674 | 1.106903 | 1.073138 |
| 2 | product(x, idxs) | 1.447502 | 1.444397 | 1.430552 | 1.443838 | 1.439283 | 1.106228 |
Figure: Benchmarking of product_x_S(), product(x, idxs)() and product(x[idxs])() on n = 100000 data. Outliers are displayed as crosses. Times are in milliseconds.
n = 1000000 vector
> x <- data[["n = 1000000"]]
> idxs <- sample.int(length(x), size = length(x) * 0.7)
> x_S <- x[idxs]
> gc()
           used  (Mb) gc trigger  (Mb)  max used  (Mb)
Ncells  5335876 285.0    8529671 455.6   8529671 455.6
Vcells 12432834  94.9   35919338 274.1 101881463 777.3
> stats <- microbenchmark(product_x_S = product(x_S, na.rm = FALSE), `product(x, idxs)` = product(x,
+     idxs = idxs, na.rm = FALSE), `product(x[idxs])` = product(x[idxs], na.rm = FALSE), unit = "ms")
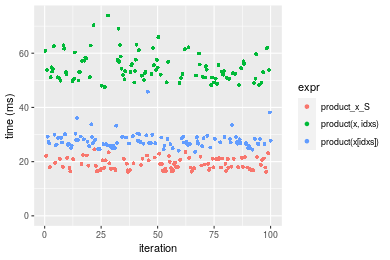
Table: Benchmarking of product_x_S(), product(x, idxs)() and product(x[idxs])() on n = 1000000 data. The top panel shows times in milliseconds and the bottom panel shows relative times.
| expr | min | lq | mean | median | uq | max | |
|---|---|---|---|---|---|---|---|
| 1 | product_x_S | 16.28687 | 17.37866 | 19.07292 | 18.52555 | 20.99975 | 24.54780 |
| 3 | product(x[idxs]) | 23.63653 | 26.26349 | 27.77526 | 27.02093 | 28.79617 | 45.83446 |
| 2 | product(x, idxs) | 47.45203 | 51.04674 | 54.85654 | 53.31008 | 57.53338 | 73.92465 |
| expr | min | lq | mean | median | uq | max | |
|---|---|---|---|---|---|---|---|
| 1 | product_x_S | 1.000000 | 1.000000 | 1.000000 | 1.000000 | 1.000000 | 1.000000 |
| 3 | product(x[idxs]) | 1.451262 | 1.511249 | 1.456267 | 1.458576 | 1.371263 | 1.867151 |
| 2 | product(x, idxs) | 2.913514 | 2.937324 | 2.876148 | 2.877651 | 2.739718 | 3.011458 |
Figure: Benchmarking of product_x_S(), product(x, idxs)() and product(x[idxs])() on n = 1000000 data. Outliers are displayed as crosses. Times are in milliseconds.
Appendix
Session information
R version 4.1.1 Patched (2021-08-10 r80727)
Platform: x86_64-pc-linux-gnu (64-bit)
Running under: Ubuntu 18.04.5 LTS

Matrix products: default
BLAS:   /home/hb/software/R-devel/R-4-1-branch/lib/R/lib/libRblas.so
LAPACK: /home/hb/software/R-devel/R-4-1-branch/lib/R/lib/libRlapack.so

locale:
 [1] LC_CTYPE=en_US.UTF-8       LC_NUMERIC=C
 [3] LC_TIME=en_US.UTF-8        LC_COLLATE=en_US.UTF-8
 [5] LC_MONETARY=en_US.UTF-8    LC_MESSAGES=en_US.UTF-8
 [7] LC_PAPER=en_US.UTF-8       LC_NAME=C
 [9] LC_ADDRESS=C               LC_TELEPHONE=C
[11] LC_MEASUREMENT=en_US.UTF-8 LC_IDENTIFICATION=C

attached base packages:
[1] stats     graphics  grDevices utils     datasets  methods   base

other attached packages:
[1] microbenchmark_1.4-7   matrixStats_0.60.1     ggplot2_3.3.5
[4] knitr_1.33             R.devices_2.17.0       R.utils_2.10.1
[7] R.oo_1.24.0            R.methodsS3_1.8.1-9001 history_0.0.1-9000

loaded via a namespace (and not attached):
 [1] Biobase_2.52.0          httr_1.4.2              splines_4.1.1
 [4] bit64_4.0.5             network_1.17.1          assertthat_0.2.1
 [7] highr_0.9               stats4_4.1.1            blob_1.2.2
[10] GenomeInfoDbData_1.2.6  robustbase_0.93-8       pillar_1.6.2
[13] RSQLite_2.2.8           lattice_0.20-44         glue_1.4.2
[16] digest_0.6.27           XVector_0.32.0          colorspace_2.0-2
[19] Matrix_1.3-4            XML_3.99-0.7            pkgconfig_2.0.3
[22] zlibbioc_1.38.0         genefilter_1.74.0       purrr_0.3.4
[25] ergm_4.1.2              xtable_1.8-4            scales_1.1.1
[28] tibble_3.1.4            annotate_1.70.0         KEGGREST_1.32.0
[31] farver_2.1.0            generics_0.1.0          IRanges_2.26.0
[34] ellipsis_0.3.2          cachem_1.0.6            withr_2.4.2
[37] BiocGenerics_0.38.0     mime_0.11               survival_3.2-13
[40] magrittr_2.0.1          crayon_1.4.1            statnet.common_4.5.0
[43] memoise_2.0.0           laeken_0.5.1            fansi_0.5.0
[46] R.cache_0.15.0          MASS_7.3-54             R.rsp_0.44.0
[49] progressr_0.8.0         tools_4.1.1             lifecycle_1.0.0
[52] S4Vectors_0.30.0        trust_0.1-8             munsell_0.5.0
[55] tabby_0.0.1-9001        AnnotationDbi_1.54.1    Biostrings_2.60.2
[58] compiler_4.1.1          GenomeInfoDb_1.28.1     rlang_0.4.11
[61] grid_4.1.1              RCurl_1.98-1.4          cwhmisc_6.6
[64] rappdirs_0.3.3          startup_0.15.0          labeling_0.4.2
[67] bitops_1.0-7            base64enc_0.1-3         boot_1.3-28
[70] gtable_0.3.0            DBI_1.1.1               markdown_1.1
[73] R6_2.5.1                lpSolveAPI_5.5.2.0-17.7 rle_0.9.2
[76] dplyr_1.0.7             fastmap_1.1.0           bit_4.0.4
[79] utf8_1.2.2              parallel_4.1.1          Rcpp_1.0.7
[82] vctrs_0.3.8             png_0.1-7               DEoptimR_1.0-9
[85] tidyselect_1.1.1        xfun_0.25               coda_0.19-4
Total processing time was 14.85 secs.
Reproducibility
To reproduce this report, do:
html <- matrixStats:::benchmark('product_subset')
Copyright Dongcan Jiang. Last updated on 2021-08-25 19:25:46 (+0200 UTC). Powered by RSP.