matrixStats.benchmarks
product() benchmarks
This report benchmark the performance of product() against alternative methods.
Alternative methods
- product_R()
- prod()
where
> product_R <- function(x, na.rm = FALSE, ...) {
+     if (length(x) == 0L)
+         return(0)
+     if (na.rm) {
+         x <- x[!is.na(x)]
+     }
+     if (is.integer(x) && any(x == 0))
+         return(0)
+     sign <- if (sum(x < 0)%%2 == 0)
+         +1     else -1
+     x <- abs(x)
+     x <- log(x)
+     x <- sum(x, na.rm = FALSE)
+     x <- exp(x)
+     y <- sign * x
+     y
+ }
Data
> rvector <- function(n, mode = c("logical", "double", "integer"), range = c(-100, +100), na_prob = 0) {
+     mode <- match.arg(mode)
+     if (mode == "logical") {
+         x <- sample(c(FALSE, TRUE), size = n, replace = TRUE)
+     }     else {
+         x <- runif(n, min = range[1], max = range[2])
+     }
+     storage.mode(x) <- mode
+     if (na_prob > 0)
+         x[sample(n, size = na_prob * n)] <- NA
+     x
+ }
> rvectors <- function(scale = 10, seed = 1, ...) {
+     set.seed(seed)
+     data <- list()
+     data[[1]] <- rvector(n = scale * 100, ...)
+     data[[2]] <- rvector(n = scale * 1000, ...)
+     data[[3]] <- rvector(n = scale * 10000, ...)
+     data[[4]] <- rvector(n = scale * 1e+05, ...)
+     data[[5]] <- rvector(n = scale * 1e+06, ...)
+     names(data) <- sprintf("n = %d", sapply(data, FUN = length))
+     data
+ }
> data <- rvectors(mode = "double")
> data <- data[1:4]
Results
n = 1000 vector
> x <- data[["n = 1000"]]
> gc()
           used  (Mb) gc trigger  (Mb)  max used  (Mb)
Ncells  5338726 285.2    8529671 455.6   8529671 455.6
Vcells 13569882 103.6   35919338 274.1 101881463 777.3
> stats <- microbenchmark(product = product(x, na.rm = FALSE), product_R = product_R(x, na.rm = FALSE),
+     prod = prod(x, na.rm = FALSE), unit = "ms")
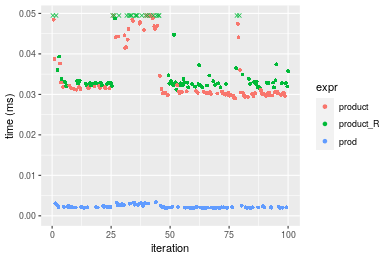
Table: Benchmarking of product(), product_R() and prod() on n = 1000 data. The top panel shows times in milliseconds and the bottom panel shows relative times.
| expr | min | lq | mean | median | uq | max | |
|---|---|---|---|---|---|---|---|
| 3 | prod | 0.001970 | 0.0020195 | 0.0022598 | 0.0020890 | 0.0023905 | 0.003337 |
| 1 | product | 0.029076 | 0.0301525 | 0.0348078 | 0.0307970 | 0.0381690 | 0.061026 |
| 2 | product_R | 0.031164 | 0.0324480 | 0.1610031 | 0.0329075 | 0.0420490 | 12.275752 |
| expr | min | lq | mean | median | uq | max | |
|---|---|---|---|---|---|---|---|
| 3 | prod | 1.00000 | 1.00000 | 1.00000 | 1.00000 | 1.00000 | 1.00000 |
| 1 | product | 14.75939 | 14.93068 | 15.40332 | 14.74246 | 15.96695 | 18.28768 |
| 2 | product_R | 15.81929 | 16.06734 | 71.24787 | 15.75275 | 17.59004 | 3678.67905 |
Figure: Benchmarking of product(), product_R() and prod() on n = 1000 data. Outliers are displayed as crosses. Times are in milliseconds.
n = 10000 vector
> x <- data[["n = 10000"]]
> gc()
           used  (Mb) gc trigger  (Mb)  max used  (Mb)
Ncells  5336554 285.1    8529671 455.6   8529671 455.6
Vcells 11385692  86.9   35919338 274.1 101881463 777.3
> stats <- microbenchmark(product = product(x, na.rm = FALSE), product_R = product_R(x, na.rm = FALSE),
+     prod = prod(x, na.rm = FALSE), unit = "ms")
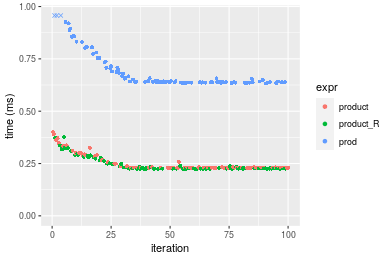
Table: Benchmarking of product(), product_R() and prod() on n = 10000 data. The top panel shows times in milliseconds and the bottom panel shows relative times.
| expr | min | lq | mean | median | uq | max | |
|---|---|---|---|---|---|---|---|
| 2 | product_R | 0.223610 | 0.2253630 | 0.2437561 | 0.226601 | 0.2467465 | 0.376809 |
| 1 | product | 0.228073 | 0.2300745 | 0.2526849 | 0.230937 | 0.2571335 | 0.400361 |
| 3 | prod | 0.632889 | 0.6381310 | 0.6922717 | 0.641637 | 0.7076230 | 1.003408 |
| expr | min | lq | mean | median | uq | max | |
|---|---|---|---|---|---|---|---|
| 2 | product_R | 1.000000 | 1.000000 | 1.000000 | 1.000000 | 1.000000 | 1.000000 |
| 1 | product | 1.019959 | 1.020906 | 1.036630 | 1.019135 | 1.042096 | 1.062504 |
| 3 | prod | 2.830325 | 2.831570 | 2.840017 | 2.831572 | 2.867814 | 2.662909 |
Figure: Benchmarking of product(), product_R() and prod() on n = 10000 data. Outliers are displayed as crosses. Times are in milliseconds.
n = 100000 vector
> x <- data[["n = 100000"]]
> gc()
           used  (Mb) gc trigger  (Mb)  max used  (Mb)
Ncells  5336626 285.1    8529671 455.6   8529671 455.6
Vcells 11386252  86.9   35919338 274.1 101881463 777.3
> stats <- microbenchmark(product = product(x, na.rm = FALSE), product_R = product_R(x, na.rm = FALSE),
+     prod = prod(x, na.rm = FALSE), unit = "ms")
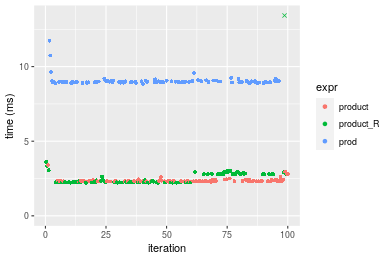
Table: Benchmarking of product(), product_R() and prod() on n = 100000 data. The top panel shows times in milliseconds and the bottom panel shows relative times.
| expr | min | lq | mean | median | uq | max | |
|---|---|---|---|---|---|---|---|
| 2 | product_R | 2.213171 | 2.239659 | 2.608884 | 2.274475 | 2.799769 | 13.582452 |
| 1 | product | 2.257990 | 2.308847 | 2.363410 | 2.313592 | 2.347230 | 3.406615 |
| 3 | prod | 8.833006 | 8.950071 | 9.047510 | 8.981056 | 9.034463 | 11.730022 |
| expr | min | lq | mean | median | uq | max | |
|---|---|---|---|---|---|---|---|
| 2 | product_R | 1.000000 | 1.000000 | 1.0000000 | 1.000000 | 1.0000000 | 1.0000000 |
| 1 | product | 1.020251 | 1.030892 | 0.9059085 | 1.017198 | 0.8383656 | 0.2508100 |
| 3 | prod | 3.991109 | 3.996176 | 3.4679621 | 3.948628 | 3.2268603 | 0.8636159 |
Figure: Benchmarking of product(), product_R() and prod() on n = 100000 data. Outliers are displayed as crosses. Times are in milliseconds.
n = 1000000 vector
> x <- data[["n = 1000000"]]
> gc()
           used  (Mb) gc trigger  (Mb)  max used  (Mb)
Ncells  5336698 285.1    8529671 455.6   8529671 455.6
Vcells 11386301  86.9   35919338 274.1 101881463 777.3
> stats <- microbenchmark(product = product(x, na.rm = FALSE), product_R = product_R(x, na.rm = FALSE),
+     prod = prod(x, na.rm = FALSE), unit = "ms")
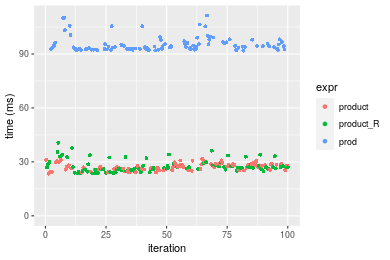
Table: Benchmarking of product(), product_R() and prod() on n = 1000000 data. The top panel shows times in milliseconds and the bottom panel shows relative times.
| expr | min | lq | mean | median | uq | max | |
|---|---|---|---|---|---|---|---|
| 2 | product_R | 23.49997 | 25.67259 | 27.69921 | 26.87910 | 28.38922 | 40.60999 |
| 1 | product | 23.46858 | 25.88476 | 27.38120 | 27.38787 | 28.57990 | 31.64119 |
| 3 | prod | 91.87098 | 92.74811 | 95.47893 | 93.95793 | 96.18996 | 111.40707 |
| expr | min | lq | mean | median | uq | max | |
|---|---|---|---|---|---|---|---|
| 2 | product_R | 1.0000000 | 1.000000 | 1.0000000 | 1.000000 | 1.000000 | 1.0000000 |
| 1 | product | 0.9986644 | 1.008264 | 0.9885191 | 1.018928 | 1.006716 | 0.7791479 |
| 3 | prod | 3.9094092 | 3.612729 | 3.4469913 | 3.495576 | 3.388256 | 2.7433413 |
Figure: Benchmarking of product(), product_R() and prod() on n = 1000000 data. Outliers are displayed as crosses. Times are in milliseconds.
Appendix
Session information
R version 4.1.1 Patched (2021-08-10 r80727)
Platform: x86_64-pc-linux-gnu (64-bit)
Running under: Ubuntu 18.04.5 LTS

Matrix products: default
BLAS:   /home/hb/software/R-devel/R-4-1-branch/lib/R/lib/libRblas.so
LAPACK: /home/hb/software/R-devel/R-4-1-branch/lib/R/lib/libRlapack.so

locale:
 [1] LC_CTYPE=en_US.UTF-8       LC_NUMERIC=C
 [3] LC_TIME=en_US.UTF-8        LC_COLLATE=en_US.UTF-8
 [5] LC_MONETARY=en_US.UTF-8    LC_MESSAGES=en_US.UTF-8
 [7] LC_PAPER=en_US.UTF-8       LC_NAME=C
 [9] LC_ADDRESS=C               LC_TELEPHONE=C
[11] LC_MEASUREMENT=en_US.UTF-8 LC_IDENTIFICATION=C

attached base packages:
[1] stats     graphics  grDevices utils     datasets  methods   base

other attached packages:
[1] microbenchmark_1.4-7   matrixStats_0.60.1     ggplot2_3.3.5
[4] knitr_1.33             R.devices_2.17.0       R.utils_2.10.1
[7] R.oo_1.24.0            R.methodsS3_1.8.1-9001 history_0.0.1-9000

loaded via a namespace (and not attached):
 [1] Biobase_2.52.0          httr_1.4.2              splines_4.1.1
 [4] bit64_4.0.5             network_1.17.1          assertthat_0.2.1
 [7] highr_0.9               stats4_4.1.1            blob_1.2.2
[10] GenomeInfoDbData_1.2.6  robustbase_0.93-8       pillar_1.6.2
[13] RSQLite_2.2.8           lattice_0.20-44         glue_1.4.2
[16] digest_0.6.27           XVector_0.32.0          colorspace_2.0-2
[19] Matrix_1.3-4            XML_3.99-0.7            pkgconfig_2.0.3
[22] zlibbioc_1.38.0         genefilter_1.74.0       purrr_0.3.4
[25] ergm_4.1.2              xtable_1.8-4            scales_1.1.1
[28] tibble_3.1.4            annotate_1.70.0         KEGGREST_1.32.0
[31] farver_2.1.0            generics_0.1.0          IRanges_2.26.0
[34] ellipsis_0.3.2          cachem_1.0.6            withr_2.4.2
[37] BiocGenerics_0.38.0     mime_0.11               survival_3.2-13
[40] magrittr_2.0.1          crayon_1.4.1            statnet.common_4.5.0
[43] memoise_2.0.0           laeken_0.5.1            fansi_0.5.0
[46] R.cache_0.15.0          MASS_7.3-54             R.rsp_0.44.0
[49] progressr_0.8.0         tools_4.1.1             lifecycle_1.0.0
[52] S4Vectors_0.30.0        trust_0.1-8             munsell_0.5.0
[55] tabby_0.0.1-9001        AnnotationDbi_1.54.1    Biostrings_2.60.2
[58] compiler_4.1.1          GenomeInfoDb_1.28.1     rlang_0.4.11
[61] grid_4.1.1              RCurl_1.98-1.4          cwhmisc_6.6
[64] rappdirs_0.3.3          startup_0.15.0          labeling_0.4.2
[67] bitops_1.0-7            base64enc_0.1-3         boot_1.3-28
[70] gtable_0.3.0            DBI_1.1.1               markdown_1.1
[73] R6_2.5.1                lpSolveAPI_5.5.2.0-17.7 rle_0.9.2
[76] dplyr_1.0.7             fastmap_1.1.0           bit_4.0.4
[79] utf8_1.2.2              parallel_4.1.1          Rcpp_1.0.7
[82] vctrs_0.3.8             png_0.1-7               DEoptimR_1.0-9
[85] tidyselect_1.1.1        xfun_0.25               coda_0.19-4
Total processing time was 22.04 secs.
Reproducibility
To reproduce this report, do:
html <- matrixStats:::benchmark('product')
Copyright Henrik Bengtsson. Last updated on 2021-08-25 19:26:09 (+0200 UTC). Powered by RSP.