matrixStats.benchmarks
logSumExp() benchmarks on subsetted computation
This report benchmark the performance of logSumExp() on subsetted computation.
Data
> rvector <- function(n, mode = c("logical", "double", "integer"), range = c(-100, +100), na_prob = 0) {
+     mode <- match.arg(mode)
+     if (mode == "logical") {
+         x <- sample(c(FALSE, TRUE), size = n, replace = TRUE)
+     }     else {
+         x <- runif(n, min = range[1], max = range[2])
+     }
+     storage.mode(x) <- mode
+     if (na_prob > 0)
+         x[sample(n, size = na_prob * n)] <- NA
+     x
+ }
> rvectors <- function(scale = 10, seed = 1, ...) {
+     set.seed(seed)
+     data <- list()
+     data[[1]] <- rvector(n = scale * 100, ...)
+     data[[2]] <- rvector(n = scale * 1000, ...)
+     data[[3]] <- rvector(n = scale * 10000, ...)
+     data[[4]] <- rvector(n = scale * 1e+05, ...)
+     data[[5]] <- rvector(n = scale * 1e+06, ...)
+     names(data) <- sprintf("n = %d", sapply(data, FUN = length))
+     data
+ }
> data <- rvectors(mode = "double")
> data <- data[1:4]
Results
n = 1000 vector
> x <- data[["n = 1000"]]
> idxs <- sample.int(length(x), size = length(x) * 0.7)
> x_S <- x[idxs]
> gc()
           used  (Mb) gc trigger  (Mb) max used  (Mb)
Ncells  5341768 285.3    8529671 455.6  8529671 455.6
Vcells 11753385  89.7   34090130 260.1 60562128 462.1
> stats <- microbenchmark(logSumExp_x_S = logSumExp(x_S), `logSumExp(x, idxs)` = logSumExp(x, idxs = idxs),
+     `logSumExp(x[idxs])` = logSumExp(x[idxs]), unit = "ms")
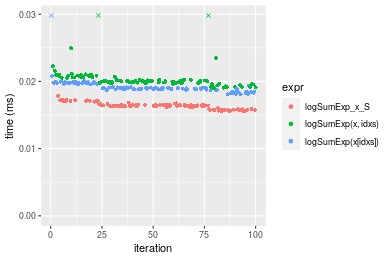
Table: Benchmarking of logSumExp_x_S(), logSumExp(x, idxs)() and logSumExp(x[idxs])() on n = 1000 data. The top panel shows times in milliseconds and the bottom panel shows relative times.
| expr | min | lq | mean | median | uq | max | |
|---|---|---|---|---|---|---|---|
| 1 | logSumExp_x_S | 0.015591 | 0.0158745 | 0.0163376 | 0.0163600 | 0.0165105 | 0.017843 |
| 3 | logSumExp(x[idxs]) | 0.018075 | 0.0188060 | 0.0192830 | 0.0189735 | 0.0196900 | 0.038997 |
| 2 | logSumExp(x, idxs) | 0.018860 | 0.0198025 | 0.0204520 | 0.0200145 | 0.0206035 | 0.034614 |
| expr | min | lq | mean | median | uq | max | |
|---|---|---|---|---|---|---|---|
| 1 | logSumExp_x_S | 1.000000 | 1.000000 | 1.000000 | 1.000000 | 1.000000 | 1.000000 |
| 3 | logSumExp(x[idxs]) | 1.159323 | 1.184667 | 1.180281 | 1.159749 | 1.192574 | 2.185563 |
| 2 | logSumExp(x, idxs) | 1.209672 | 1.247441 | 1.251834 | 1.223380 | 1.247903 | 1.939920 |
Figure: Benchmarking of logSumExp_x_S(), logSumExp(x, idxs)() and logSumExp(x[idxs])() on n = 1000 data. Outliers are displayed as crosses. Times are in milliseconds.
n = 10000 vector
> x <- data[["n = 10000"]]
> idxs <- sample.int(length(x), size = length(x) * 0.7)
> x_S <- x[idxs]
> gc()
           used  (Mb) gc trigger  (Mb) max used  (Mb)
Ncells  5328711 284.6    8529671 455.6  8529671 455.6
Vcells 11386811  86.9   34090130 260.1 60562128 462.1
> stats <- microbenchmark(logSumExp_x_S = logSumExp(x_S), `logSumExp(x, idxs)` = logSumExp(x, idxs = idxs),
+     `logSumExp(x[idxs])` = logSumExp(x[idxs]), unit = "ms")
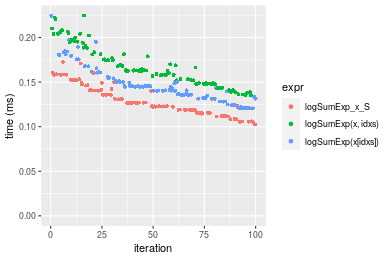
Table: Benchmarking of logSumExp_x_S(), logSumExp(x, idxs)() and logSumExp(x[idxs])() on n = 10000 data. The top panel shows times in milliseconds and the bottom panel shows relative times.
| expr | min | lq | mean | median | uq | max | |
|---|---|---|---|---|---|---|---|
| 1 | logSumExp_x_S | 0.102405 | 0.1153345 | 0.1293270 | 0.1244830 | 0.1407065 | 0.172723 |
| 3 | logSumExp(x[idxs]) | 0.120531 | 0.1327280 | 0.1463184 | 0.1438555 | 0.1542785 | 0.224230 |
| 2 | logSumExp(x, idxs) | 0.135196 | 0.1481720 | 0.1669454 | 0.1624540 | 0.1813390 | 0.224668 |
| expr | min | lq | mean | median | uq | max | |
|---|---|---|---|---|---|---|---|
| 1 | logSumExp_x_S | 1.000000 | 1.000000 | 1.000000 | 1.000000 | 1.000000 | 1.000000 |
| 3 | logSumExp(x[idxs]) | 1.177003 | 1.150809 | 1.131384 | 1.155624 | 1.096456 | 1.298206 |
| 2 | logSumExp(x, idxs) | 1.320209 | 1.284715 | 1.290879 | 1.305030 | 1.288775 | 1.300742 |
Figure: Benchmarking of logSumExp_x_S(), logSumExp(x, idxs)() and logSumExp(x[idxs])() on n = 10000 data. Outliers are displayed as crosses. Times are in milliseconds.
n = 100000 vector
> x <- data[["n = 100000"]]
> idxs <- sample.int(length(x), size = length(x) * 0.7)
> x_S <- x[idxs]
> gc()
           used  (Mb) gc trigger  (Mb) max used  (Mb)
Ncells  5328783 284.6    8529671 455.6  8529671 455.6
Vcells 11481871  87.6   34090130 260.1 60562128 462.1
> stats <- microbenchmark(logSumExp_x_S = logSumExp(x_S), `logSumExp(x, idxs)` = logSumExp(x, idxs = idxs),
+     `logSumExp(x[idxs])` = logSumExp(x[idxs]), unit = "ms")
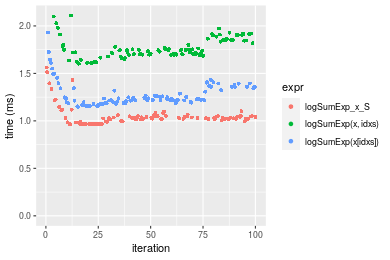
Table: Benchmarking of logSumExp_x_S(), logSumExp(x, idxs)() and logSumExp(x[idxs])() on n = 100000 data. The top panel shows times in milliseconds and the bottom panel shows relative times.
| expr | min | lq | mean | median | uq | max | |
|---|---|---|---|---|---|---|---|
| 1 | logSumExp_x_S | 0.963657 | 1.014990 | 1.050716 | 1.029772 | 1.048861 | 1.561737 |
| 3 | logSumExp(x[idxs]) | 1.146242 | 1.194862 | 1.278392 | 1.232443 | 1.349690 | 1.931844 |
| 2 | logSumExp(x, idxs) | 1.602609 | 1.699938 | 1.767231 | 1.741054 | 1.848653 | 2.109960 |
| expr | min | lq | mean | median | uq | max | |
|---|---|---|---|---|---|---|---|
| 1 | logSumExp_x_S | 1.000000 | 1.000000 | 1.000000 | 1.000000 | 1.000000 | 1.000000 |
| 3 | logSumExp(x[idxs]) | 1.189471 | 1.177215 | 1.216687 | 1.196811 | 1.286815 | 1.236984 |
| 2 | logSumExp(x, idxs) | 1.663049 | 1.674831 | 1.681931 | 1.690717 | 1.762534 | 1.351034 |
Figure: Benchmarking of logSumExp_x_S(), logSumExp(x, idxs)() and logSumExp(x[idxs])() on n = 100000 data. Outliers are displayed as crosses. Times are in milliseconds.
n = 1000000 vector
> x <- data[["n = 1000000"]]
> idxs <- sample.int(length(x), size = length(x) * 0.7)
> x_S <- x[idxs]
> gc()
           used  (Mb) gc trigger  (Mb) max used  (Mb)
Ncells  5328855 284.6    8529671 455.6  8529671 455.6
Vcells 12426920  94.9   34090130 260.1 60562128 462.1
> stats <- microbenchmark(logSumExp_x_S = logSumExp(x_S), `logSumExp(x, idxs)` = logSumExp(x, idxs = idxs),
+     `logSumExp(x[idxs])` = logSumExp(x[idxs]), unit = "ms")
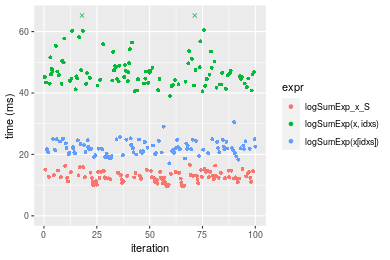
Table: Benchmarking of logSumExp_x_S(), logSumExp(x, idxs)() and logSumExp(x[idxs])() on n = 1000000 data. The top panel shows times in milliseconds and the bottom panel shows relative times.
| expr | min | lq | mean | median | uq | max | |
|---|---|---|---|---|---|---|---|
| 1 | logSumExp_x_S | 9.649558 | 11.47577 | 12.70166 | 12.55980 | 14.13723 | 16.59399 |
| 3 | logSumExp(x[idxs]) | 17.076022 | 20.58465 | 22.11247 | 21.81947 | 23.81086 | 30.47616 |
| 2 | logSumExp(x, idxs) | 38.975856 | 43.54822 | 47.22513 | 45.88667 | 48.54235 | 72.45369 |
| expr | min | lq | mean | median | uq | max | |
|---|---|---|---|---|---|---|---|
| 1 | logSumExp_x_S | 1.000000 | 1.000000 | 1.000000 | 1.000000 | 1.000000 | 1.000000 |
| 3 | logSumExp(x[idxs]) | 1.769617 | 1.793749 | 1.740911 | 1.737247 | 1.684266 | 1.836579 |
| 2 | logSumExp(x, idxs) | 4.039134 | 3.794798 | 3.718028 | 3.653456 | 3.433652 | 4.366262 |
Figure: Benchmarking of logSumExp_x_S(), logSumExp(x, idxs)() and logSumExp(x[idxs])() on n = 1000000 data. Outliers are displayed as crosses. Times are in milliseconds.
Appendix
Session information
R version 4.1.1 Patched (2021-08-10 r80727)
Platform: x86_64-pc-linux-gnu (64-bit)
Running under: Ubuntu 18.04.5 LTS

Matrix products: default
BLAS:   /home/hb/software/R-devel/R-4-1-branch/lib/R/lib/libRblas.so
LAPACK: /home/hb/software/R-devel/R-4-1-branch/lib/R/lib/libRlapack.so

locale:
 [1] LC_CTYPE=en_US.UTF-8       LC_NUMERIC=C
 [3] LC_TIME=en_US.UTF-8        LC_COLLATE=en_US.UTF-8
 [5] LC_MONETARY=en_US.UTF-8    LC_MESSAGES=en_US.UTF-8
 [7] LC_PAPER=en_US.UTF-8       LC_NAME=C
 [9] LC_ADDRESS=C               LC_TELEPHONE=C
[11] LC_MEASUREMENT=en_US.UTF-8 LC_IDENTIFICATION=C

attached base packages:
[1] stats     graphics  grDevices utils     datasets  methods   base

other attached packages:
[1] microbenchmark_1.4-7   matrixStats_0.60.1     ggplot2_3.3.5
[4] knitr_1.33             R.devices_2.17.0       R.utils_2.10.1
[7] R.oo_1.24.0            R.methodsS3_1.8.1-9001 history_0.0.1-9000

loaded via a namespace (and not attached):
 [1] Biobase_2.52.0          httr_1.4.2              splines_4.1.1
 [4] bit64_4.0.5             network_1.17.1          assertthat_0.2.1
 [7] highr_0.9               stats4_4.1.1            blob_1.2.2
[10] GenomeInfoDbData_1.2.6  robustbase_0.93-8       pillar_1.6.2
[13] RSQLite_2.2.8           lattice_0.20-44         glue_1.4.2
[16] digest_0.6.27           XVector_0.32.0          colorspace_2.0-2
[19] Matrix_1.3-4            XML_3.99-0.7            pkgconfig_2.0.3
[22] zlibbioc_1.38.0         genefilter_1.74.0       purrr_0.3.4
[25] ergm_4.1.2              xtable_1.8-4            scales_1.1.1
[28] tibble_3.1.4            annotate_1.70.0         KEGGREST_1.32.0
[31] farver_2.1.0            generics_0.1.0          IRanges_2.26.0
[34] ellipsis_0.3.2          cachem_1.0.6            withr_2.4.2
[37] BiocGenerics_0.38.0     mime_0.11               survival_3.2-13
[40] magrittr_2.0.1          crayon_1.4.1            statnet.common_4.5.0
[43] memoise_2.0.0           laeken_0.5.1            fansi_0.5.0
[46] R.cache_0.15.0          MASS_7.3-54             R.rsp_0.44.0
[49] progressr_0.8.0         tools_4.1.1             lifecycle_1.0.0
[52] S4Vectors_0.30.0        trust_0.1-8             munsell_0.5.0
[55] tabby_0.0.1-9001        AnnotationDbi_1.54.1    Biostrings_2.60.2
[58] compiler_4.1.1          GenomeInfoDb_1.28.1     rlang_0.4.11
[61] grid_4.1.1              RCurl_1.98-1.4          cwhmisc_6.6
[64] rappdirs_0.3.3          startup_0.15.0          labeling_0.4.2
[67] bitops_1.0-7            base64enc_0.1-3         boot_1.3-28
[70] gtable_0.3.0            DBI_1.1.1               markdown_1.1
[73] R6_2.5.1                lpSolveAPI_5.5.2.0-17.7 rle_0.9.2
[76] dplyr_1.0.7             fastmap_1.1.0           bit_4.0.4
[79] utf8_1.2.2              parallel_4.1.1          Rcpp_1.0.7
[82] vctrs_0.3.8             png_0.1-7               DEoptimR_1.0-9
[85] tidyselect_1.1.1        xfun_0.25               coda_0.19-4
Total processing time was 12.61 secs.
Reproducibility
To reproduce this report, do:
html <- matrixStats:::benchmark('logSumExp_subset')
Copyright Dongcan Jiang. Last updated on 2021-08-25 19:14:45 (+0200 UTC). Powered by RSP.