matrixStats.benchmarks
colWeightedMedians() and rowWeightedMedians() benchmarks
This report benchmark the performance of colWeightedMedians() and rowWeightedMedians() against alternative methods.
Alternative methods
- apply() + weightedMedian()
Data
> rmatrix <- function(nrow, ncol, mode = c("logical", "double", "integer", "index"), range = c(-100,
+     +100), na_prob = 0) {
+     mode <- match.arg(mode)
+     n <- nrow * ncol
+     if (mode == "logical") {
+         x <- sample(c(FALSE, TRUE), size = n, replace = TRUE)
+     }     else if (mode == "index") {
+         x <- seq_len(n)
+         mode <- "integer"
+     }     else {
+         x <- runif(n, min = range[1], max = range[2])
+     }
+     storage.mode(x) <- mode
+     if (na_prob > 0)
+         x[sample(n, size = na_prob * n)] <- NA
+     dim(x) <- c(nrow, ncol)
+     x
+ }
> rmatrices <- function(scale = 10, seed = 1, ...) {
+     set.seed(seed)
+     data <- list()
+     data[[1]] <- rmatrix(nrow = scale * 1, ncol = scale * 1, ...)
+     data[[2]] <- rmatrix(nrow = scale * 10, ncol = scale * 10, ...)
+     data[[3]] <- rmatrix(nrow = scale * 100, ncol = scale * 1, ...)
+     data[[4]] <- t(data[[3]])
+     data[[5]] <- rmatrix(nrow = scale * 10, ncol = scale * 100, ...)
+     data[[6]] <- t(data[[5]])
+     names(data) <- sapply(data, FUN = function(x) paste(dim(x), collapse = "x"))
+     data
+ }
> data <- rmatrices(mode = "double")
Results
10x10 matrix
> X <- data[["10x10"]]
> w <- runif(nrow(X))
> gc()
           used  (Mb) gc trigger  (Mb) max used  (Mb)
Ncells  5336126 285.0    8529671 455.6  8529671 455.6
Vcells 10891982  83.1   31876688 243.2 60562128 462.1
> colStats <- microbenchmark(colWeightedMedians = colWeightedMedians(X, w = w, na.rm = FALSE), `apply+weigthedMedian` = apply(X,
+     MARGIN = 2L, FUN = weightedMedian, w = w, na.rm = FALSE), unit = "ms")
> X <- t(X)
> gc()
           used  (Mb) gc trigger  (Mb) max used  (Mb)
Ncells  5325293 284.5    8529671 455.6  8529671 455.6
Vcells 10856360  82.9   31876688 243.2 60562128 462.1
> rowStats <- microbenchmark(rowWeightedMedians = rowWeightedMedians(X, w = w, na.rm = FALSE), `apply+weigthedMedian` = apply(X,
+     MARGIN = 1L, FUN = weightedMedian, w = w, na.rm = FALSE), unit = "ms")
Table: Benchmarking of colWeightedMedians() and apply+weigthedMedian() on 10x10 data. The top panel shows times in milliseconds and the bottom panel shows relative times.
| expr | min | lq | mean | median | uq | max | |
|---|---|---|---|---|---|---|---|
| 2 | apply+weigthedMedian | 0.057735 | 0.0607080 | 0.0643024 | 0.0626710 | 0.0653680 | 0.152657 |
| 1 | colWeightedMedians | 0.069744 | 0.0727645 | 0.0767094 | 0.0751535 | 0.0786175 | 0.112733 |
| expr | min | lq | mean | median | uq | max | |
|---|---|---|---|---|---|---|---|
| 2 | apply+weigthedMedian | 1.000000 | 1.000000 | 1.000000 | 1.000000 | 1.000000 | 1.0000000 |
| 1 | colWeightedMedians | 1.208002 | 1.198598 | 1.192948 | 1.199175 | 1.202691 | 0.7384725 |
Table: Benchmarking of rowWeightedMedians() and apply+weigthedMedian() on 10x10 data (transposed). The top panel shows times in milliseconds and the bottom panel shows relative times.
| expr | min | lq | mean | median | uq | max | |
|---|---|---|---|---|---|---|---|
| 2 | apply+weigthedMedian | 0.054782 | 0.0593475 | 0.0631794 | 0.0613125 | 0.0648945 | 0.145517 |
| 1 | rowWeightedMedians | 0.067214 | 0.0728870 | 0.0767203 | 0.0758585 | 0.0801185 | 0.112614 |
| expr | min | lq | mean | median | uq | max | |
|---|---|---|---|---|---|---|---|
| 2 | apply+weigthedMedian | 1.000000 | 1.000000 | 1.000000 | 1.000000 | 1.000000 | 1.000000 |
| 1 | rowWeightedMedians | 1.226936 | 1.228139 | 1.214324 | 1.237244 | 1.234596 | 0.773889 |
Figure: Benchmarking of colWeightedMedians() and apply+weigthedMedian() on 10x10 data as well as rowWeightedMedians() and apply+weigthedMedian() on the same data transposed. Outliers are displayed as crosses. Times are in milliseconds.
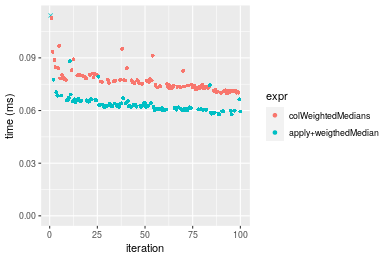
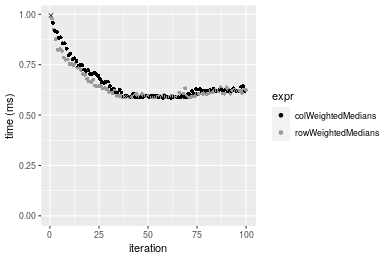
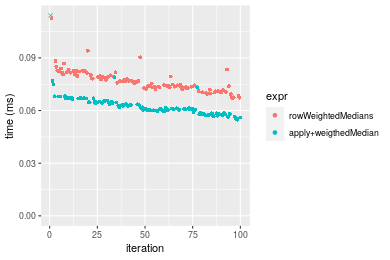 Table: Benchmarking of colWeightedMedians() and rowWeightedMedians() on 10x10 data (original and transposed). The top panel shows times in milliseconds and the bottom panel shows relative times.
| expr | min | lq | mean | median | uq | max | |
|---|---|---|---|---|---|---|---|
| 1 | colWeightedMedians | 69.744 | 72.7645 | 76.70944 | 75.1535 | 78.6175 | 112.733 |
| 2 | rowWeightedMedians | 67.214 | 72.8870 | 76.72029 | 75.8585 | 80.1185 | 112.614 |
| expr | min | lq | mean | median | uq | max | |
|---|---|---|---|---|---|---|---|
| 1 | colWeightedMedians | 1.0000000 | 1.000000 | 1.000000 | 1.000000 | 1.000000 | 1.0000000 |
| 2 | rowWeightedMedians | 0.9637245 | 1.001683 | 1.000141 | 1.009381 | 1.019092 | 0.9989444 |
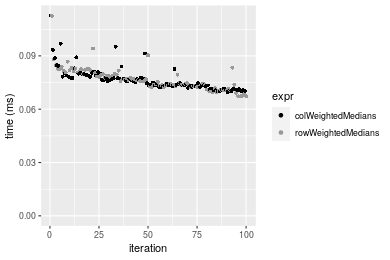
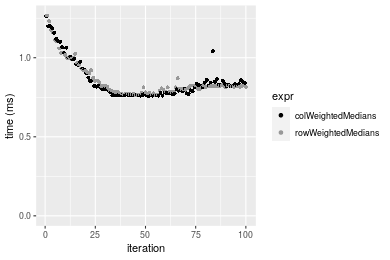
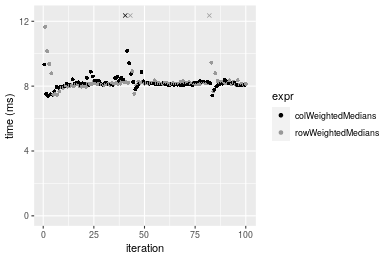
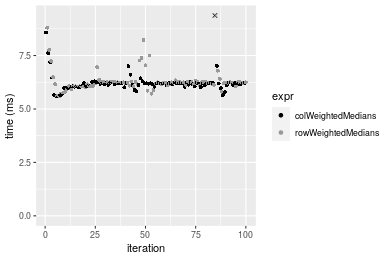
Figure: Benchmarking of colWeightedMedians() and rowWeightedMedians() on 10x10 data (original and transposed). Outliers are displayed as crosses. Times are in milliseconds.
100x100 matrix
> X <- data[["100x100"]]
> w <- runif(nrow(X))
> gc()
           used  (Mb) gc trigger  (Mb) max used  (Mb)
Ncells  5323872 284.4    8529671 455.6  8529671 455.6
Vcells 10471222  79.9   31876688 243.2 60562128 462.1
> colStats <- microbenchmark(colWeightedMedians = colWeightedMedians(X, w = w, na.rm = FALSE), `apply+weigthedMedian` = apply(X,
+     MARGIN = 2L, FUN = weightedMedian, w = w, na.rm = FALSE), unit = "ms")
> X <- t(X)
> gc()
           used  (Mb) gc trigger  (Mb) max used  (Mb)
Ncells  5323848 284.4    8529671 455.6  8529671 455.6
Vcells 10481235  80.0   31876688 243.2 60562128 462.1
> rowStats <- microbenchmark(rowWeightedMedians = rowWeightedMedians(X, w = w, na.rm = FALSE), `apply+weigthedMedian` = apply(X,
+     MARGIN = 1L, FUN = weightedMedian, w = w, na.rm = FALSE), unit = "ms")
Table: Benchmarking of colWeightedMedians() and apply+weigthedMedian() on 100x100 data. The top panel shows times in milliseconds and the bottom panel shows relative times.
| expr | min | lq | mean | median | uq | max | |
|---|---|---|---|---|---|---|---|
| 2 | apply+weigthedMedian | 0.698149 | 0.7197470 | 0.7778816 | 0.755399 | 0.7825195 | 1.254192 |
| 1 | colWeightedMedians | 0.755686 | 0.7709115 | 0.8548933 | 0.818420 | 0.8587720 | 1.262195 |
| expr | min | lq | mean | median | uq | max | |
|---|---|---|---|---|---|---|---|
| 2 | apply+weigthedMedian | 1.000000 | 1.000000 | 1.000000 | 1.000000 | 1.000000 | 1.000000 |
| 1 | colWeightedMedians | 1.082414 | 1.071087 | 1.099002 | 1.083427 | 1.097445 | 1.006381 |
Table: Benchmarking of rowWeightedMedians() and apply+weigthedMedian() on 100x100 data (transposed). The top panel shows times in milliseconds and the bottom panel shows relative times.
| expr | min | lq | mean | median | uq | max | |
|---|---|---|---|---|---|---|---|
| 2 | apply+weigthedMedian | 0.699066 | 0.712970 | 0.7666201 | 0.7449215 | 0.7633770 | 1.247787 |
| 1 | rowWeightedMedians | 0.762679 | 0.785641 | 0.8554737 | 0.8185300 | 0.8626815 | 1.267212 |
| expr | min | lq | mean | median | uq | max | |
|---|---|---|---|---|---|---|---|
| 2 | apply+weigthedMedian | 1.000000 | 1.000000 | 1.000000 | 1.000000 | 1.000000 | 1.000000 |
| 1 | rowWeightedMedians | 1.090997 | 1.101927 | 1.115903 | 1.098814 | 1.130086 | 1.015568 |
Figure: Benchmarking of colWeightedMedians() and apply+weigthedMedian() on 100x100 data as well as rowWeightedMedians() and apply+weigthedMedian() on the same data transposed. Outliers are displayed as crosses. Times are in milliseconds.
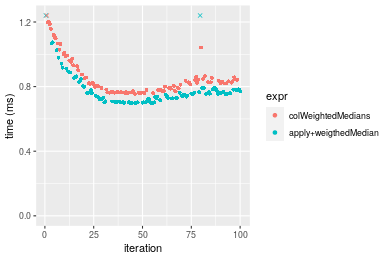
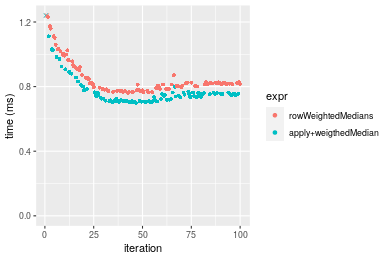 Table: Benchmarking of colWeightedMedians() and rowWeightedMedians() on 100x100 data (original and transposed). The top panel shows times in milliseconds and the bottom panel shows relative times.
| expr | min | lq | mean | median | uq | max | |
|---|---|---|---|---|---|---|---|
| 1 | colWeightedMedians | 755.686 | 770.9115 | 854.8933 | 818.42 | 858.7720 | 1262.195 |
| 2 | rowWeightedMedians | 762.679 | 785.6410 | 855.4737 | 818.53 | 862.6815 | 1267.212 |
| expr | min | lq | mean | median | uq | max | |
|---|---|---|---|---|---|---|---|
| 1 | colWeightedMedians | 1.000000 | 1.000000 | 1.000000 | 1.000000 | 1.000000 | 1.000000 |
| 2 | rowWeightedMedians | 1.009254 | 1.019107 | 1.000679 | 1.000134 | 1.004552 | 1.003975 |
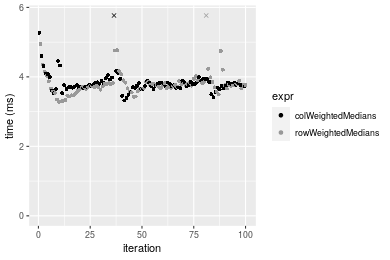
Figure: Benchmarking of colWeightedMedians() and rowWeightedMedians() on 100x100 data (original and transposed). Outliers are displayed as crosses. Times are in milliseconds.
1000x10 matrix
> X <- data[["1000x10"]]
> w <- runif(nrow(X))
> gc()
           used  (Mb) gc trigger  (Mb) max used  (Mb)
Ncells  5324573 284.4    8529671 455.6  8529671 455.6
Vcells 10475586  80.0   31876688 243.2 60562128 462.1
> colStats <- microbenchmark(colWeightedMedians = colWeightedMedians(X, w = w, na.rm = FALSE), `apply+weigthedMedian` = apply(X,
+     MARGIN = 2L, FUN = weightedMedian, w = w, na.rm = FALSE), unit = "ms")
> X <- t(X)
> gc()
           used  (Mb) gc trigger  (Mb) max used  (Mb)
Ncells  5324567 284.4    8529671 455.6  8529671 455.6
Vcells 10485629  80.0   31876688 243.2 60562128 462.1
> rowStats <- microbenchmark(rowWeightedMedians = rowWeightedMedians(X, w = w, na.rm = FALSE), `apply+weigthedMedian` = apply(X,
+     MARGIN = 1L, FUN = weightedMedian, w = w, na.rm = FALSE), unit = "ms")
Table: Benchmarking of colWeightedMedians() and apply+weigthedMedian() on 1000x10 data. The top panel shows times in milliseconds and the bottom panel shows relative times.
| expr | min | lq | mean | median | uq | max | |
|---|---|---|---|---|---|---|---|
| 2 | apply+weigthedMedian | 0.566671 | 0.5727345 | 0.6213638 | 0.5881475 | 0.6245870 | 0.941552 |
| 1 | colWeightedMedians | 0.585212 | 0.5931230 | 0.6585967 | 0.6203480 | 0.6876295 | 1.078221 |
| expr | min | lq | mean | median | uq | max | |
|---|---|---|---|---|---|---|---|
| 2 | apply+weigthedMedian | 1.000000 | 1.000000 | 1.000000 | 1.000000 | 1.000000 | 1.000000 |
| 1 | colWeightedMedians | 1.032719 | 1.035599 | 1.059921 | 1.054749 | 1.100935 | 1.145153 |
Table: Benchmarking of rowWeightedMedians() and apply+weigthedMedian() on 1000x10 data (transposed). The top panel shows times in milliseconds and the bottom panel shows relative times.
| expr | min | lq | mean | median | uq | max | |
|---|---|---|---|---|---|---|---|
| 2 | apply+weigthedMedian | 0.567541 | 0.572906 | 0.6191645 | 0.585090 | 0.6164795 | 0.860573 |
| 1 | rowWeightedMedians | 0.588173 | 0.594631 | 0.6423677 | 0.610705 | 0.6421510 | 0.978510 |
| expr | min | lq | mean | median | uq | max | |
|---|---|---|---|---|---|---|---|
| 2 | apply+weigthedMedian | 1.000000 | 1.000000 | 1.000000 | 1.00000 | 1.000000 | 1.000000 |
| 1 | rowWeightedMedians | 1.036353 | 1.037921 | 1.037475 | 1.04378 | 1.041642 | 1.137045 |
Figure: Benchmarking of colWeightedMedians() and apply+weigthedMedian() on 1000x10 data as well as rowWeightedMedians() and apply+weigthedMedian() on the same data transposed. Outliers are displayed as crosses. Times are in milliseconds.
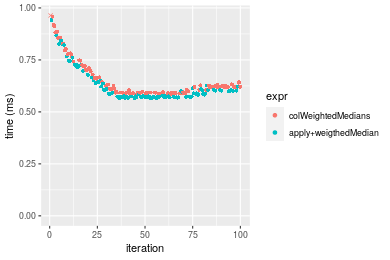
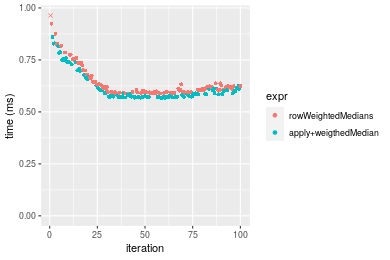 Table: Benchmarking of colWeightedMedians() and rowWeightedMedians() on 1000x10 data (original and transposed). The top panel shows times in milliseconds and the bottom panel shows relative times.
| expr | min | lq | mean | median | uq | max | |
|---|---|---|---|---|---|---|---|
| 2 | rowWeightedMedians | 588.173 | 594.631 | 642.3677 | 610.705 | 642.1510 | 978.510 |
| 1 | colWeightedMedians | 585.212 | 593.123 | 658.5968 | 620.348 | 687.6295 | 1078.221 |
| expr | min | lq | mean | median | uq | max | |
|---|---|---|---|---|---|---|---|
| 2 | rowWeightedMedians | 1.0000000 | 1.000000 | 1.000000 | 1.00000 | 1.000000 | 1.000000 |
| 1 | colWeightedMedians | 0.9949658 | 0.997464 | 1.025265 | 1.01579 | 1.070822 | 1.101901 |
Figure: Benchmarking of colWeightedMedians() and rowWeightedMedians() on 1000x10 data (original and transposed). Outliers are displayed as crosses. Times are in milliseconds.
10x1000 matrix
> X <- data[["10x1000"]]
> w <- runif(nrow(X))
> gc()
           used  (Mb) gc trigger  (Mb) max used  (Mb)
Ncells  5324789 284.4    8529671 455.6  8529671 455.6
Vcells 10475454  80.0   31876688 243.2 60562128 462.1
> colStats <- microbenchmark(colWeightedMedians = colWeightedMedians(X, w = w, na.rm = FALSE), `apply+weigthedMedian` = apply(X,
+     MARGIN = 2L, FUN = weightedMedian, w = w, na.rm = FALSE), unit = "ms")
> X <- t(X)
> gc()
           used  (Mb) gc trigger  (Mb) max used  (Mb)
Ncells  5324765 284.4    8529671 455.6  8529671 455.6
Vcells 10485467  80.0   31876688 243.2 60562128 462.1
> rowStats <- microbenchmark(rowWeightedMedians = rowWeightedMedians(X, w = w, na.rm = FALSE), `apply+weigthedMedian` = apply(X,
+     MARGIN = 1L, FUN = weightedMedian, w = w, na.rm = FALSE), unit = "ms")
Table: Benchmarking of colWeightedMedians() and apply+weigthedMedian() on 10x1000 data. The top panel shows times in milliseconds and the bottom panel shows relative times.
| expr | min | lq | mean | median | uq | max | |
|---|---|---|---|---|---|---|---|
| 2 | apply+weigthedMedian | 2.753192 | 3.078094 | 3.213874 | 3.144999 | 3.216814 | 9.785959 |
| 1 | colWeightedMedians | 3.321706 | 3.697391 | 3.871337 | 3.772746 | 3.853225 | 10.209476 |
| expr | min | lq | mean | median | uq | max | |
|---|---|---|---|---|---|---|---|
| 2 | apply+weigthedMedian | 1.000000 | 1.000000 | 1.00000 | 1.000000 | 1.000000 | 1.000000 |
| 1 | colWeightedMedians | 1.206493 | 1.201195 | 1.20457 | 1.199601 | 1.197839 | 1.043278 |
Table: Benchmarking of rowWeightedMedians() and apply+weigthedMedian() on 10x1000 data (transposed). The top panel shows times in milliseconds and the bottom panel shows relative times.
| expr | min | lq | mean | median | uq | max | |
|---|---|---|---|---|---|---|---|
| 2 | apply+weigthedMedian | 2.783791 | 3.10578 | 3.236681 | 3.157621 | 3.213204 | 9.654826 |
| 1 | rowWeightedMedians | 3.281124 | 3.66063 | 3.842434 | 3.759111 | 3.838177 | 10.139083 |
| expr | min | lq | mean | median | uq | max | |
|---|---|---|---|---|---|---|---|
| 2 | apply+weigthedMedian | 1.000000 | 1.000000 | 1.000000 | 1.000000 | 1.000000 | 1.000000 |
| 1 | rowWeightedMedians | 1.178653 | 1.178651 | 1.187153 | 1.190488 | 1.194502 | 1.050157 |
Figure: Benchmarking of colWeightedMedians() and apply+weigthedMedian() on 10x1000 data as well as rowWeightedMedians() and apply+weigthedMedian() on the same data transposed. Outliers are displayed as crosses. Times are in milliseconds.
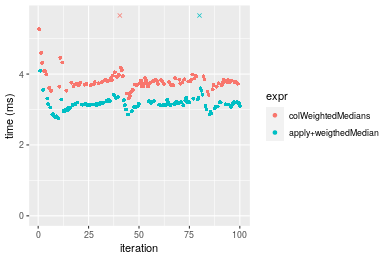
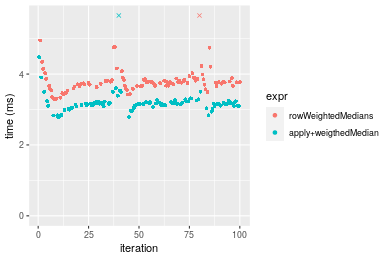 Table: Benchmarking of colWeightedMedians() and rowWeightedMedians() on 10x1000 data (original and transposed). The top panel shows times in milliseconds and the bottom panel shows relative times.
| expr | min | lq | mean | median | uq | max | |
|---|---|---|---|---|---|---|---|
| 2 | rowWeightedMedians | 3.281124 | 3.660630 | 3.842434 | 3.759111 | 3.838177 | 10.13908 |
| 1 | colWeightedMedians | 3.321706 | 3.697391 | 3.871337 | 3.772746 | 3.853225 | 10.20948 |
| expr | min | lq | mean | median | uq | max | |
|---|---|---|---|---|---|---|---|
| 2 | rowWeightedMedians | 1.000000 | 1.000000 | 1.000000 | 1.000000 | 1.00000 | 1.000000 |
| 1 | colWeightedMedians | 1.012368 | 1.010042 | 1.007522 | 1.003627 | 1.00392 | 1.006943 |
Figure: Benchmarking of colWeightedMedians() and rowWeightedMedians() on 10x1000 data (original and transposed). Outliers are displayed as crosses. Times are in milliseconds.
100x1000 matrix
> X <- data[["100x1000"]]
> w <- runif(nrow(X))
> gc()
           used  (Mb) gc trigger  (Mb) max used  (Mb)
Ncells  5324967 284.4    8529671 455.6  8529671 455.6
Vcells 10476036  80.0   31876688 243.2 60562128 462.1
> colStats <- microbenchmark(colWeightedMedians = colWeightedMedians(X, w = w, na.rm = FALSE), `apply+weigthedMedian` = apply(X,
+     MARGIN = 2L, FUN = weightedMedian, w = w, na.rm = FALSE), unit = "ms")
> X <- t(X)
> gc()
           used  (Mb) gc trigger  (Mb) max used  (Mb)
Ncells  5324955 284.4    8529671 455.6  8529671 455.6
Vcells 10576069  80.7   31876688 243.2 60562128 462.1
> rowStats <- microbenchmark(rowWeightedMedians = rowWeightedMedians(X, w = w, na.rm = FALSE), `apply+weigthedMedian` = apply(X,
+     MARGIN = 1L, FUN = weightedMedian, w = w, na.rm = FALSE), unit = "ms")
Table: Benchmarking of colWeightedMedians() and apply+weigthedMedian() on 100x1000 data. The top panel shows times in milliseconds and the bottom panel shows relative times.
| expr | min | lq | mean | median | uq | max | |
|---|---|---|---|---|---|---|---|
| 2 | apply+weigthedMedian | 6.890591 | 7.480619 | 7.825088 | 7.554851 | 7.633451 | 27.24606 |
| 1 | colWeightedMedians | 7.395820 | 8.068511 | 8.369593 | 8.148709 | 8.241084 | 26.70743 |
| expr | min | lq | mean | median | uq | max | |
|---|---|---|---|---|---|---|---|
| 2 | apply+weigthedMedian | 1.000000 | 1.000000 | 1.000000 | 1.000000 | 1.000000 | 1.000000 |
| 1 | colWeightedMedians | 1.073322 | 1.078589 | 1.069584 | 1.078606 | 1.079601 | 0.980231 |
Table: Benchmarking of rowWeightedMedians() and apply+weigthedMedian() on 100x1000 data (transposed). The top panel shows times in milliseconds and the bottom panel shows relative times.
| expr | min | lq | mean | median | uq | max | |
|---|---|---|---|---|---|---|---|
| 2 | apply+weigthedMedian | 6.926695 | 7.492705 | 7.639871 | 7.559138 | 7.635518 | 9.637283 |
| 1 | rowWeightedMedians | 7.464479 | 8.106582 | 8.607993 | 8.156696 | 8.231931 | 27.903324 |
| expr | min | lq | mean | median | uq | max | |
|---|---|---|---|---|---|---|---|
| 2 | apply+weigthedMedian | 1.000000 | 1.00000 | 1.00000 | 1.000000 | 1.00000 | 1.000000 |
| 1 | rowWeightedMedians | 1.077639 | 1.08193 | 1.12672 | 1.079051 | 1.07811 | 2.895352 |
Figure: Benchmarking of colWeightedMedians() and apply+weigthedMedian() on 100x1000 data as well as rowWeightedMedians() and apply+weigthedMedian() on the same data transposed. Outliers are displayed as crosses. Times are in milliseconds.
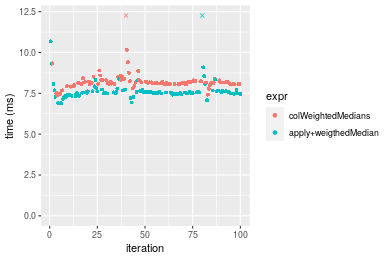
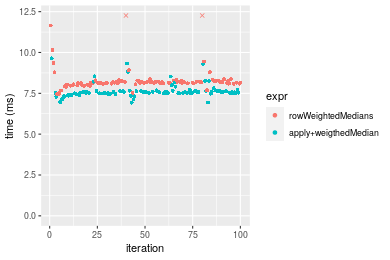 Table: Benchmarking of colWeightedMedians() and rowWeightedMedians() on 100x1000 data (original and transposed). The top panel shows times in milliseconds and the bottom panel shows relative times.
| expr | min | lq | mean | median | uq | max | |
|---|---|---|---|---|---|---|---|
| 1 | colWeightedMedians | 7.395820 | 8.068511 | 8.369593 | 8.148709 | 8.241084 | 26.70743 |
| 2 | rowWeightedMedians | 7.464479 | 8.106582 | 8.607993 | 8.156696 | 8.231931 | 27.90332 |
| expr | min | lq | mean | median | uq | max | |
|---|---|---|---|---|---|---|---|
| 1 | colWeightedMedians | 1.000000 | 1.000000 | 1.000000 | 1.00000 | 1.0000000 | 1.000000 |
| 2 | rowWeightedMedians | 1.009284 | 1.004719 | 1.028484 | 1.00098 | 0.9988893 | 1.044778 |
Figure: Benchmarking of colWeightedMedians() and rowWeightedMedians() on 100x1000 data (original and transposed). Outliers are displayed as crosses. Times are in milliseconds.
1000x100 matrix
> X <- data[["1000x100"]]
> w <- runif(nrow(X))
> gc()
           used  (Mb) gc trigger  (Mb) max used  (Mb)
Ncells  5325154 284.4    8529671 455.6  8529671 455.6
Vcells 10477585  80.0   31876688 243.2 60562128 462.1
> colStats <- microbenchmark(colWeightedMedians = colWeightedMedians(X, w = w, na.rm = FALSE), `apply+weigthedMedian` = apply(X,
+     MARGIN = 2L, FUN = weightedMedian, w = w, na.rm = FALSE), unit = "ms")
> X <- t(X)
> gc()
           used  (Mb) gc trigger  (Mb) max used  (Mb)
Ncells  5325142 284.4    8529671 455.6  8529671 455.6
Vcells 10577618  80.8   31876688 243.2 60562128 462.1
> rowStats <- microbenchmark(rowWeightedMedians = rowWeightedMedians(X, w = w, na.rm = FALSE), `apply+weigthedMedian` = apply(X,
+     MARGIN = 1L, FUN = weightedMedian, w = w, na.rm = FALSE), unit = "ms")
Table: Benchmarking of colWeightedMedians() and apply+weigthedMedian() on 1000x100 data. The top panel shows times in milliseconds and the bottom panel shows relative times.
| expr | min | lq | mean | median | uq | max | |
|---|---|---|---|---|---|---|---|
| 2 | apply+weigthedMedian | 5.487842 | 5.976517 | 6.143820 | 6.082755 | 6.133801 | 14.53874 |
| 1 | colWeightedMedians | 5.581019 | 6.066359 | 6.287458 | 6.192349 | 6.224260 | 15.38716 |
| expr | min | lq | mean | median | uq | max | |
|---|---|---|---|---|---|---|---|
| 2 | apply+weigthedMedian | 1.000000 | 1.000000 | 1.000000 | 1.000000 | 1.000000 | 1.000000 |
| 1 | colWeightedMedians | 1.016979 | 1.015032 | 1.023379 | 1.018017 | 1.014748 | 1.058356 |
Table: Benchmarking of rowWeightedMedians() and apply+weigthedMedian() on 1000x100 data (transposed). The top panel shows times in milliseconds and the bottom panel shows relative times.
| expr | min | lq | mean | median | uq | max | |
|---|---|---|---|---|---|---|---|
| 2 | apply+weigthedMedian | 5.535188 | 6.018122 | 6.206917 | 6.141623 | 6.169907 | 15.39945 |
| 1 | rowWeightedMedians | 5.601261 | 6.088288 | 6.376918 | 6.229851 | 6.260240 | 15.11609 |
| expr | min | lq | mean | median | uq | max | |
|---|---|---|---|---|---|---|---|
| 2 | apply+weigthedMedian | 1.000000 | 1.000000 | 1.000000 | 1.000000 | 1.000000 | 1.0000000 |
| 1 | rowWeightedMedians | 1.011937 | 1.011659 | 1.027389 | 1.014365 | 1.014641 | 0.9815997 |
Figure: Benchmarking of colWeightedMedians() and apply+weigthedMedian() on 1000x100 data as well as rowWeightedMedians() and apply+weigthedMedian() on the same data transposed. Outliers are displayed as crosses. Times are in milliseconds.
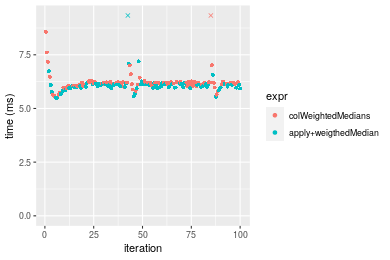
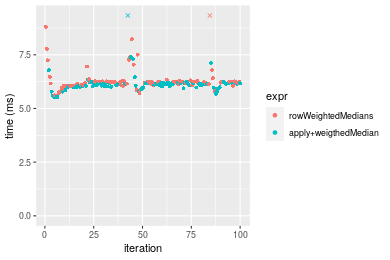 Table: Benchmarking of colWeightedMedians() and rowWeightedMedians() on 1000x100 data (original and transposed). The top panel shows times in milliseconds and the bottom panel shows relative times.
| expr | min | lq | mean | median | uq | max | |
|---|---|---|---|---|---|---|---|
| 1 | colWeightedMedians | 5.581019 | 6.066359 | 6.287458 | 6.192349 | 6.22426 | 15.38716 |
| 2 | rowWeightedMedians | 5.601261 | 6.088288 | 6.376918 | 6.229851 | 6.26024 | 15.11609 |
| expr | min | lq | mean | median | uq | max | |
|---|---|---|---|---|---|---|---|
| 1 | colWeightedMedians | 1.000000 | 1.000000 | 1.000000 | 1.000000 | 1.00000 | 1.0000000 |
| 2 | rowWeightedMedians | 1.003627 | 1.003615 | 1.014228 | 1.006056 | 1.00578 | 0.9823835 |
Figure: Benchmarking of colWeightedMedians() and rowWeightedMedians() on 1000x100 data (original and transposed). Outliers are displayed as crosses. Times are in milliseconds.
Appendix
Session information
R version 4.1.1 Patched (2021-08-10 r80727)
Platform: x86_64-pc-linux-gnu (64-bit)
Running under: Ubuntu 18.04.5 LTS

Matrix products: default
BLAS:   /home/hb/software/R-devel/R-4-1-branch/lib/R/lib/libRblas.so
LAPACK: /home/hb/software/R-devel/R-4-1-branch/lib/R/lib/libRlapack.so

locale:
 [1] LC_CTYPE=en_US.UTF-8       LC_NUMERIC=C
 [3] LC_TIME=en_US.UTF-8        LC_COLLATE=en_US.UTF-8
 [5] LC_MONETARY=en_US.UTF-8    LC_MESSAGES=en_US.UTF-8
 [7] LC_PAPER=en_US.UTF-8       LC_NAME=C
 [9] LC_ADDRESS=C               LC_TELEPHONE=C
[11] LC_MEASUREMENT=en_US.UTF-8 LC_IDENTIFICATION=C

attached base packages:
[1] stats     graphics  grDevices utils     datasets  methods   base

other attached packages:
[1] microbenchmark_1.4-7   matrixStats_0.60.1     ggplot2_3.3.5
[4] knitr_1.33             R.devices_2.17.0       R.utils_2.10.1
[7] R.oo_1.24.0            R.methodsS3_1.8.1-9001 history_0.0.1-9000

loaded via a namespace (and not attached):
 [1] Biobase_2.52.0          httr_1.4.2              splines_4.1.1
 [4] bit64_4.0.5             network_1.17.1          assertthat_0.2.1
 [7] highr_0.9               stats4_4.1.1            blob_1.2.2
[10] GenomeInfoDbData_1.2.6  robustbase_0.93-8       pillar_1.6.2
[13] RSQLite_2.2.8           lattice_0.20-44         glue_1.4.2
[16] digest_0.6.27           XVector_0.32.0          colorspace_2.0-2
[19] Matrix_1.3-4            XML_3.99-0.7            pkgconfig_2.0.3
[22] zlibbioc_1.38.0         genefilter_1.74.0       purrr_0.3.4
[25] ergm_4.1.2              xtable_1.8-4            scales_1.1.1
[28] tibble_3.1.4            annotate_1.70.0         KEGGREST_1.32.0
[31] farver_2.1.0            generics_0.1.0          IRanges_2.26.0
[34] ellipsis_0.3.2          cachem_1.0.6            withr_2.4.2
[37] BiocGenerics_0.38.0     mime_0.11               survival_3.2-13
[40] magrittr_2.0.1          crayon_1.4.1            statnet.common_4.5.0
[43] memoise_2.0.0           laeken_0.5.1            fansi_0.5.0
[46] R.cache_0.15.0          MASS_7.3-54             R.rsp_0.44.0
[49] progressr_0.8.0         tools_4.1.1             lifecycle_1.0.0
[52] S4Vectors_0.30.0        trust_0.1-8             munsell_0.5.0
[55] tabby_0.0.1-9001        AnnotationDbi_1.54.1    Biostrings_2.60.2
[58] compiler_4.1.1          GenomeInfoDb_1.28.1     rlang_0.4.11
[61] grid_4.1.1              RCurl_1.98-1.4          cwhmisc_6.6
[64] rappdirs_0.3.3          startup_0.15.0          labeling_0.4.2
[67] bitops_1.0-7            base64enc_0.1-3         boot_1.3-28
[70] gtable_0.3.0            DBI_1.1.1               markdown_1.1
[73] R6_2.5.1                lpSolveAPI_5.5.2.0-17.7 rle_0.9.2
[76] dplyr_1.0.7             fastmap_1.1.0           bit_4.0.4
[79] utf8_1.2.2              parallel_4.1.1          Rcpp_1.0.7
[82] vctrs_0.3.8             png_0.1-7               DEoptimR_1.0-9
[85] tidyselect_1.1.1        xfun_0.25               coda_0.19-4
Total processing time was 19.23 secs.
Reproducibility
To reproduce this report, do:
html <- matrixStats:::benchmark('colWeightedMedians')
Copyright Henrik Bengtsson. Last updated on 2021-08-25 19:12:19 (+0200 UTC). Powered by RSP.