matrixStats.benchmarks
colWeightedMeans() and rowWeightedMeans() benchmarks on subsetted computation
This report benchmark the performance of colWeightedMeans() and rowWeightedMeans() on subsetted computation.
Data
> rmatrix <- function(nrow, ncol, mode = c("logical", "double", "integer", "index"), range = c(-100,
+     +100), na_prob = 0) {
+     mode <- match.arg(mode)
+     n <- nrow * ncol
+     if (mode == "logical") {
+         x <- sample(c(FALSE, TRUE), size = n, replace = TRUE)
+     }     else if (mode == "index") {
+         x <- seq_len(n)
+         mode <- "integer"
+     }     else {
+         x <- runif(n, min = range[1], max = range[2])
+     }
+     storage.mode(x) <- mode
+     if (na_prob > 0)
+         x[sample(n, size = na_prob * n)] <- NA
+     dim(x) <- c(nrow, ncol)
+     x
+ }
> rmatrices <- function(scale = 10, seed = 1, ...) {
+     set.seed(seed)
+     data <- list()
+     data[[1]] <- rmatrix(nrow = scale * 1, ncol = scale * 1, ...)
+     data[[2]] <- rmatrix(nrow = scale * 10, ncol = scale * 10, ...)
+     data[[3]] <- rmatrix(nrow = scale * 100, ncol = scale * 1, ...)
+     data[[4]] <- t(data[[3]])
+     data[[5]] <- rmatrix(nrow = scale * 10, ncol = scale * 100, ...)
+     data[[6]] <- t(data[[5]])
+     names(data) <- sapply(data, FUN = function(x) paste(dim(x), collapse = "x"))
+     data
+ }
> data <- rmatrices(mode = "double")
Results
10x10 matrix
> X <- data[["10x10"]]
> rows <- sample.int(nrow(X), size = nrow(X) * 0.7)
> cols <- sample.int(ncol(X), size = ncol(X) * 0.7)
> X_S <- X[rows, cols]
> w <- runif(nrow(X))
> w_S <- w[rows]
> gc()
           used  (Mb) gc trigger  (Mb) max used  (Mb)
Ncells  5325256 284.4    8529671 455.6  8529671 455.6
Vcells 10757231  82.1   31876688 243.2 60562128 462.1
> colStats <- microbenchmark(colWeightedMeans_X_w_S = colWeightedMeans(X_S, w = w_S, na.rm = FALSE),
+     `colWeightedMeans(X, w, rows, cols)` = colWeightedMeans(X, w = w, rows = rows, cols = cols, na.rm = FALSE),
+     `colWeightedMeans(X[rows, cols], w[rows])` = colWeightedMeans(X[rows, cols], w = w[rows], na.rm = FALSE),
+     unit = "ms")
> X <- t(X)
> X_S <- t(X_S)
> gc()
           used  (Mb) gc trigger  (Mb) max used  (Mb)
Ncells  5315960 284.0    8529671 455.6  8529671 455.6
Vcells 10726254  81.9   31876688 243.2 60562128 462.1
> rowStats <- microbenchmark(rowWeightedMeans_X_w_S = rowWeightedMeans(X_S, w = w_S, na.rm = FALSE),
+     `rowWeightedMeans(X, w, cols, rows)` = rowWeightedMeans(X, w = w, rows = cols, cols = rows, na.rm = FALSE),
+     `rowWeightedMeans(X[cols, rows], w[rows])` = rowWeightedMeans(X[cols, rows], w = w[rows], na.rm = FALSE),
+     unit = "ms")
Table: Benchmarking of colWeightedMeans_X_w_S(), colWeightedMeans(X, w, rows, cols)() and colWeightedMeans(X[rows, cols], w[rows])() on 10x10 data. The top panel shows times in milliseconds and the bottom panel shows relative times.
| expr | min | lq | mean | median | uq | max | |
|---|---|---|---|---|---|---|---|
| 1 | colWeightedMeans_X_w_S | 0.014470 | 0.014981 | 0.0155045 | 0.015280 | 0.0158510 | 0.027004 |
| 3 | colWeightedMeans(X[rows, cols], w[rows]) | 0.016255 | 0.016827 | 0.0177645 | 0.017344 | 0.0179600 | 0.032018 |
| 2 | colWeightedMeans(X, w, rows, cols) | 0.017700 | 0.018331 | 0.0230068 | 0.018772 | 0.0191295 | 0.435820 |
| expr | min | lq | mean | median | uq | max | |
|---|---|---|---|---|---|---|---|
| 1 | colWeightedMeans_X_w_S | 1.000000 | 1.000000 | 1.000000 | 1.000000 | 1.000000 | 1.000000 |
| 3 | colWeightedMeans(X[rows, cols], w[rows]) | 1.123359 | 1.123223 | 1.145763 | 1.135079 | 1.133052 | 1.185676 |
| 2 | colWeightedMeans(X, w, rows, cols) | 1.223221 | 1.223617 | 1.483880 | 1.228534 | 1.206832 | 16.139090 |
Table: Benchmarking of rowWeightedMeans_X_w_S(), rowWeightedMeans(X, w, cols, rows)() and rowWeightedMeans(X[cols, rows], w[rows])() on 10x10 data (transposed). The top panel shows times in milliseconds and the bottom panel shows relative times.
| expr | min | lq | mean | median | uq | max | |
|---|---|---|---|---|---|---|---|
| 1 | rowWeightedMeans_X_w_S | 0.018896 | 0.0194165 | 0.0202958 | 0.0198445 | 0.0206840 | 0.035495 |
| 3 | rowWeightedMeans(X[cols, rows], w[rows]) | 0.020614 | 0.0212005 | 0.0219963 | 0.0216765 | 0.0224660 | 0.032308 |
| 2 | rowWeightedMeans(X, w, cols, rows) | 0.022414 | 0.0231110 | 0.0296008 | 0.0235790 | 0.0243585 | 0.566980 |
| expr | min | lq | mean | median | uq | max | |
|---|---|---|---|---|---|---|---|
| 1 | rowWeightedMeans_X_w_S | 1.000000 | 1.000000 | 1.000000 | 1.000000 | 1.000000 | 1.0000000 |
| 3 | rowWeightedMeans(X[cols, rows], w[rows]) | 1.090919 | 1.091881 | 1.083784 | 1.092318 | 1.086153 | 0.9102127 |
| 2 | rowWeightedMeans(X, w, cols, rows) | 1.186177 | 1.190276 | 1.458466 | 1.188188 | 1.177649 | 15.9735174 |
Figure: Benchmarking of colWeightedMeans_X_w_S(), colWeightedMeans(X, w, rows, cols)() and colWeightedMeans(X[rows, cols], w[rows])() on 10x10 data as well as rowWeightedMeans_X_w_S(), rowWeightedMeans(X, w, cols, rows)() and rowWeightedMeans(X[cols, rows], w[rows])() on the same data transposed. Outliers are displayed as crosses. Times are in milliseconds.
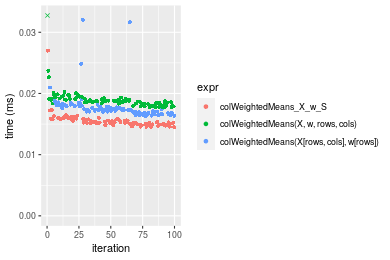
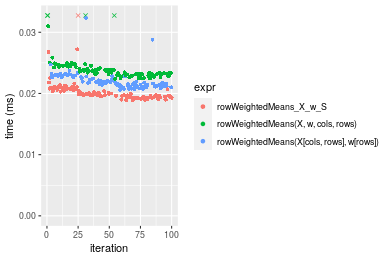 Table: Benchmarking of colWeightedMeans_X_w_S() and rowWeightedMeans_X_w_S() on 10x10 data (original and transposed). The top panel shows times in milliseconds and the bottom panel shows relative times.
| expr | min | lq | mean | median | uq | max | |
|---|---|---|---|---|---|---|---|
| 1 | colWeightedMeans_X_w_S | 14.470 | 14.9810 | 15.50451 | 15.2800 | 15.851 | 27.004 |
| 2 | rowWeightedMeans_X_w_S | 18.896 | 19.4165 | 20.29581 | 19.8445 | 20.684 | 35.495 |
| expr | min | lq | mean | median | uq | max | |
|---|---|---|---|---|---|---|---|
| 1 | colWeightedMeans_X_w_S | 1.000000 | 1.000000 | 1.000000 | 1.000000 | 1.000000 | 1.000000 |
| 2 | rowWeightedMeans_X_w_S | 1.305874 | 1.296075 | 1.309026 | 1.298724 | 1.304902 | 1.314435 |
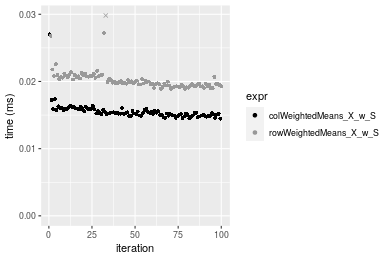
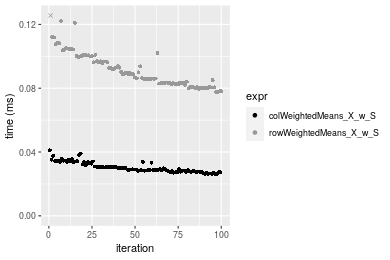
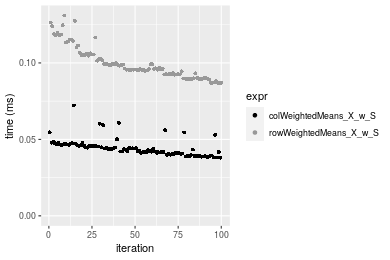
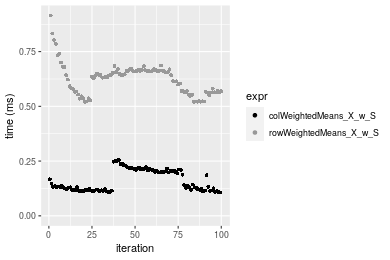
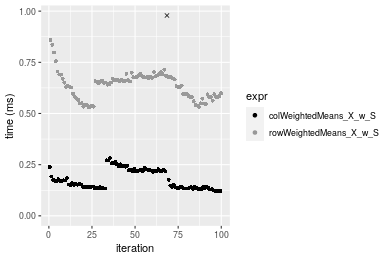
Figure: Benchmarking of colWeightedMeans_X_w_S() and rowWeightedMeans_X_w_S() on 10x10 data (original and transposed). Outliers are displayed as crosses. Times are in milliseconds.
100x100 matrix
> X <- data[["100x100"]]
> rows <- sample.int(nrow(X), size = nrow(X) * 0.7)
> cols <- sample.int(ncol(X), size = ncol(X) * 0.7)
> X_S <- X[rows, cols]
> w <- runif(nrow(X))
> w_S <- w[rows]
> gc()
           used  (Mb) gc trigger  (Mb) max used  (Mb)
Ncells  5315147 283.9    8529671 455.6  8529671 455.6
Vcells 10397059  79.4   31876688 243.2 60562128 462.1
> colStats <- microbenchmark(colWeightedMeans_X_w_S = colWeightedMeans(X_S, w = w_S, na.rm = FALSE),
+     `colWeightedMeans(X, w, rows, cols)` = colWeightedMeans(X, w = w, rows = rows, cols = cols, na.rm = FALSE),
+     `colWeightedMeans(X[rows, cols], w[rows])` = colWeightedMeans(X[rows, cols], w = w[rows], na.rm = FALSE),
+     unit = "ms")
> X <- t(X)
> X_S <- t(X_S)
> gc()
           used  (Mb) gc trigger  (Mb) max used  (Mb)
Ncells  5315123 283.9    8529671 455.6  8529671 455.6
Vcells 10407112  79.4   31876688 243.2 60562128 462.1
> rowStats <- microbenchmark(rowWeightedMeans_X_w_S = rowWeightedMeans(X_S, w = w_S, na.rm = FALSE),
+     `rowWeightedMeans(X, w, cols, rows)` = rowWeightedMeans(X, w = w, rows = cols, cols = rows, na.rm = FALSE),
+     `rowWeightedMeans(X[cols, rows], w[rows])` = rowWeightedMeans(X[cols, rows], w = w[rows], na.rm = FALSE),
+     unit = "ms")
Table: Benchmarking of colWeightedMeans_X_w_S(), colWeightedMeans(X, w, rows, cols)() and colWeightedMeans(X[rows, cols], w[rows])() on 100x100 data. The top panel shows times in milliseconds and the bottom panel shows relative times.
| expr | min | lq | mean | median | uq | max | |
|---|---|---|---|---|---|---|---|
| 1 | colWeightedMeans_X_w_S | 0.026212 | 0.0279685 | 0.0303416 | 0.0292475 | 0.0329180 | 0.041039 |
| 3 | colWeightedMeans(X[rows, cols], w[rows]) | 0.040471 | 0.0444045 | 0.0482202 | 0.0474340 | 0.0500500 | 0.079303 |
| 2 | colWeightedMeans(X, w, rows, cols) | 0.055636 | 0.0601385 | 0.0655575 | 0.0638050 | 0.0689055 | 0.192947 |
| expr | min | lq | mean | median | uq | max | |
|---|---|---|---|---|---|---|---|
| 1 | colWeightedMeans_X_w_S | 1.000000 | 1.000000 | 1.000000 | 1.000000 | 1.000000 | 1.000000 |
| 3 | colWeightedMeans(X[rows, cols], w[rows]) | 1.543988 | 1.587661 | 1.589245 | 1.621814 | 1.520445 | 1.932381 |
| 2 | colWeightedMeans(X, w, rows, cols) | 2.122539 | 2.150223 | 2.160647 | 2.181554 | 2.093247 | 4.701552 |
Table: Benchmarking of rowWeightedMeans_X_w_S(), rowWeightedMeans(X, w, cols, rows)() and rowWeightedMeans(X[cols, rows], w[rows])() on 100x100 data (transposed). The top panel shows times in milliseconds and the bottom panel shows relative times.
| expr | min | lq | mean | median | uq | max | |
|---|---|---|---|---|---|---|---|
| 1 | rowWeightedMeans_X_w_S | 0.077298 | 0.0829720 | 0.0913286 | 0.0888450 | 0.0999010 | 0.125572 |
| 3 | rowWeightedMeans(X[cols, rows], w[rows]) | 0.090650 | 0.0975855 | 0.1055107 | 0.1011425 | 0.1098525 | 0.198671 |
| 2 | rowWeightedMeans(X, w, cols, rows) | 0.103670 | 0.1111375 | 0.1192483 | 0.1155785 | 0.1276455 | 0.148688 |
| expr | min | lq | mean | median | uq | max | |
|---|---|---|---|---|---|---|---|
| 1 | rowWeightedMeans_X_w_S | 1.000000 | 1.000000 | 1.000000 | 1.000000 | 1.000000 | 1.000000 |
| 3 | rowWeightedMeans(X[cols, rows], w[rows]) | 1.172734 | 1.176126 | 1.155286 | 1.138415 | 1.099614 | 1.582128 |
| 2 | rowWeightedMeans(X, w, cols, rows) | 1.341173 | 1.339458 | 1.305707 | 1.300900 | 1.277720 | 1.184086 |
Figure: Benchmarking of colWeightedMeans_X_w_S(), colWeightedMeans(X, w, rows, cols)() and colWeightedMeans(X[rows, cols], w[rows])() on 100x100 data as well as rowWeightedMeans_X_w_S(), rowWeightedMeans(X, w, cols, rows)() and rowWeightedMeans(X[cols, rows], w[rows])() on the same data transposed. Outliers are displayed as crosses. Times are in milliseconds.
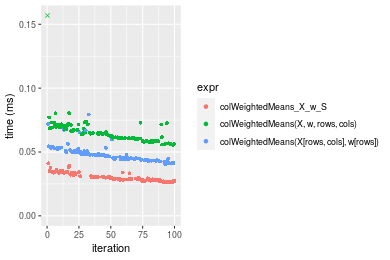
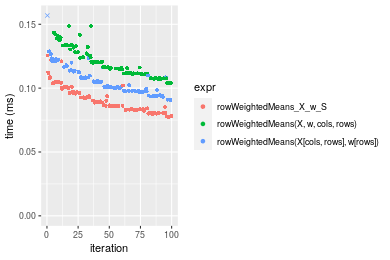 Table: Benchmarking of colWeightedMeans_X_w_S() and rowWeightedMeans_X_w_S() on 100x100 data (original and transposed). The top panel shows times in milliseconds and the bottom panel shows relative times.
| expr | min | lq | mean | median | uq | max | |
|---|---|---|---|---|---|---|---|
| 1 | colWeightedMeans_X_w_S | 26.212 | 27.9685 | 30.34161 | 29.2475 | 32.918 | 41.039 |
| 2 | rowWeightedMeans_X_w_S | 77.298 | 82.9720 | 91.32858 | 88.8450 | 99.901 | 125.572 |
| expr | min | lq | mean | median | uq | max | |
|---|---|---|---|---|---|---|---|
| 1 | colWeightedMeans_X_w_S | 1.000000 | 1.000000 | 1.000000 | 1.000000 | 1.000000 | 1.000000 |
| 2 | rowWeightedMeans_X_w_S | 2.948955 | 2.966623 | 3.010011 | 3.037695 | 3.034844 | 3.059821 |
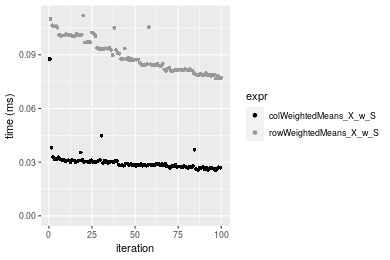
Figure: Benchmarking of colWeightedMeans_X_w_S() and rowWeightedMeans_X_w_S() on 100x100 data (original and transposed). Outliers are displayed as crosses. Times are in milliseconds.
1000x10 matrix
> X <- data[["1000x10"]]
> rows <- sample.int(nrow(X), size = nrow(X) * 0.7)
> cols <- sample.int(ncol(X), size = ncol(X) * 0.7)
> X_S <- X[rows, cols]
> w <- runif(nrow(X))
> w_S <- w[rows]
> gc()
           used  (Mb) gc trigger  (Mb) max used  (Mb)
Ncells  5315879 283.9    8529671 455.6  8529671 455.6
Vcells 10402945  79.4   31876688 243.2 60562128 462.1
> colStats <- microbenchmark(colWeightedMeans_X_w_S = colWeightedMeans(X_S, w = w_S, na.rm = FALSE),
+     `colWeightedMeans(X, w, rows, cols)` = colWeightedMeans(X, w = w, rows = rows, cols = cols, na.rm = FALSE),
+     `colWeightedMeans(X[rows, cols], w[rows])` = colWeightedMeans(X[rows, cols], w = w[rows], na.rm = FALSE),
+     unit = "ms")
> X <- t(X)
> X_S <- t(X_S)
> gc()
           used  (Mb) gc trigger  (Mb) max used  (Mb)
Ncells  5315873 283.9    8529671 455.6  8529671 455.6
Vcells 10413028  79.5   31876688 243.2 60562128 462.1
> rowStats <- microbenchmark(rowWeightedMeans_X_w_S = rowWeightedMeans(X_S, w = w_S, na.rm = FALSE),
+     `rowWeightedMeans(X, w, cols, rows)` = rowWeightedMeans(X, w = w, rows = cols, cols = rows, na.rm = FALSE),
+     `rowWeightedMeans(X[cols, rows], w[rows])` = rowWeightedMeans(X[cols, rows], w = w[rows], na.rm = FALSE),
+     unit = "ms")
Table: Benchmarking of colWeightedMeans_X_w_S(), colWeightedMeans(X, w, rows, cols)() and colWeightedMeans(X[rows, cols], w[rows])() on 1000x10 data. The top panel shows times in milliseconds and the bottom panel shows relative times.
| expr | min | lq | mean | median | uq | max | |
|---|---|---|---|---|---|---|---|
| 1 | colWeightedMeans_X_w_S | 0.038104 | 0.0408960 | 0.0442664 | 0.0436305 | 0.0461355 | 0.072222 |
| 3 | colWeightedMeans(X[rows, cols], w[rows]) | 0.054300 | 0.0577795 | 0.0626517 | 0.0612850 | 0.0664535 | 0.103451 |
| 2 | colWeightedMeans(X, w, rows, cols) | 0.070953 | 0.0768015 | 0.0828859 | 0.0809855 | 0.0866975 | 0.172090 |
| expr | min | lq | mean | median | uq | max | |
|---|---|---|---|---|---|---|---|
| 1 | colWeightedMeans_X_w_S | 1.000000 | 1.000000 | 1.000000 | 1.000000 | 1.000000 | 1.000000 |
| 3 | colWeightedMeans(X[rows, cols], w[rows]) | 1.425047 | 1.412840 | 1.415334 | 1.404637 | 1.440398 | 1.432403 |
| 2 | colWeightedMeans(X, w, rows, cols) | 1.862088 | 1.877971 | 1.872435 | 1.856167 | 1.879193 | 2.382792 |
Table: Benchmarking of rowWeightedMeans_X_w_S(), rowWeightedMeans(X, w, cols, rows)() and rowWeightedMeans(X[cols, rows], w[rows])() on 1000x10 data (transposed). The top panel shows times in milliseconds and the bottom panel shows relative times.
| expr | min | lq | mean | median | uq | max | |
|---|---|---|---|---|---|---|---|
| 1 | rowWeightedMeans_X_w_S | 0.086664 | 0.0923950 | 0.0995987 | 0.0959575 | 0.104999 | 0.131020 |
| 3 | rowWeightedMeans(X[cols, rows], w[rows]) | 0.103605 | 0.1104925 | 0.1208998 | 0.1180840 | 0.129648 | 0.160354 |
| 2 | rowWeightedMeans(X, w, cols, rows) | 0.121188 | 0.1300625 | 0.1422750 | 0.1386305 | 0.148343 | 0.248344 |
| expr | min | lq | mean | median | uq | max | |
|---|---|---|---|---|---|---|---|
| 1 | rowWeightedMeans_X_w_S | 1.000000 | 1.000000 | 1.000000 | 1.000000 | 1.000000 | 1.000000 |
| 3 | rowWeightedMeans(X[cols, rows], w[rows]) | 1.195479 | 1.195871 | 1.213870 | 1.230587 | 1.234755 | 1.223890 |
| 2 | rowWeightedMeans(X, w, cols, rows) | 1.398366 | 1.407679 | 1.428483 | 1.444707 | 1.412804 | 1.895466 |
Figure: Benchmarking of colWeightedMeans_X_w_S(), colWeightedMeans(X, w, rows, cols)() and colWeightedMeans(X[rows, cols], w[rows])() on 1000x10 data as well as rowWeightedMeans_X_w_S(), rowWeightedMeans(X, w, cols, rows)() and rowWeightedMeans(X[cols, rows], w[rows])() on the same data transposed. Outliers are displayed as crosses. Times are in milliseconds.
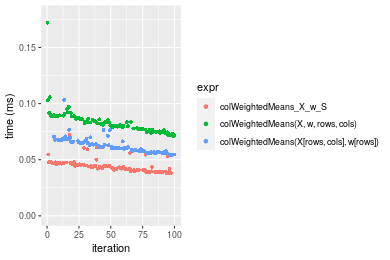
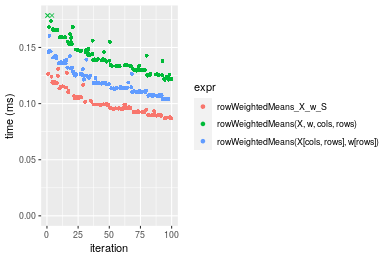 Table: Benchmarking of colWeightedMeans_X_w_S() and rowWeightedMeans_X_w_S() on 1000x10 data (original and transposed). The top panel shows times in milliseconds and the bottom panel shows relative times.
| expr | min | lq | mean | median | uq | max | |
|---|---|---|---|---|---|---|---|
| 1 | colWeightedMeans_X_w_S | 38.104 | 40.896 | 44.26638 | 43.6305 | 46.1355 | 72.222 |
| 2 | rowWeightedMeans_X_w_S | 86.664 | 92.395 | 99.59866 | 95.9575 | 104.9990 | 131.020 |
| expr | min | lq | mean | median | uq | max | |
|---|---|---|---|---|---|---|---|
| 1 | colWeightedMeans_X_w_S | 1.000000 | 1.000000 | 1.000000 | 1.000000 | 1.000000 | 1.000000 |
| 2 | rowWeightedMeans_X_w_S | 2.274407 | 2.259267 | 2.249984 | 2.199322 | 2.275883 | 1.814129 |
Figure: Benchmarking of colWeightedMeans_X_w_S() and rowWeightedMeans_X_w_S() on 1000x10 data (original and transposed). Outliers are displayed as crosses. Times are in milliseconds.
10x1000 matrix
> X <- data[["10x1000"]]
> rows <- sample.int(nrow(X), size = nrow(X) * 0.7)
> cols <- sample.int(ncol(X), size = ncol(X) * 0.7)
> X_S <- X[rows, cols]
> w <- runif(nrow(X))
> w_S <- w[rows]
> gc()
           used  (Mb) gc trigger  (Mb) max used  (Mb)
Ncells  5316109 284.0    8529671 455.6  8529671 455.6
Vcells 10402265  79.4   31876688 243.2 60562128 462.1
> colStats <- microbenchmark(colWeightedMeans_X_w_S = colWeightedMeans(X_S, w = w_S, na.rm = FALSE),
+     `colWeightedMeans(X, w, rows, cols)` = colWeightedMeans(X, w = w, rows = rows, cols = cols, na.rm = FALSE),
+     `colWeightedMeans(X[rows, cols], w[rows])` = colWeightedMeans(X[rows, cols], w = w[rows], na.rm = FALSE),
+     unit = "ms")
> X <- t(X)
> X_S <- t(X_S)
> gc()
           used  (Mb) gc trigger  (Mb) max used  (Mb)
Ncells  5316085 284.0    8529671 455.6  8529671 455.6
Vcells 10412318  79.5   31876688 243.2 60562128 462.1
> rowStats <- microbenchmark(rowWeightedMeans_X_w_S = rowWeightedMeans(X_S, w = w_S, na.rm = FALSE),
+     `rowWeightedMeans(X, w, cols, rows)` = rowWeightedMeans(X, w = w, rows = cols, cols = rows, na.rm = FALSE),
+     `rowWeightedMeans(X[cols, rows], w[rows])` = rowWeightedMeans(X[cols, rows], w = w[rows], na.rm = FALSE),
+     unit = "ms")
Table: Benchmarking of colWeightedMeans_X_w_S(), colWeightedMeans(X, w, rows, cols)() and colWeightedMeans(X[rows, cols], w[rows])() on 10x1000 data. The top panel shows times in milliseconds and the bottom panel shows relative times.
| expr | min | lq | mean | median | uq | max | |
|---|---|---|---|---|---|---|---|
| 1 | colWeightedMeans_X_w_S | 0.025434 | 0.0276360 | 0.0298427 | 0.0286650 | 0.0304655 | 0.087633 |
| 3 | colWeightedMeans(X[rows, cols], w[rows]) | 0.042692 | 0.0460385 | 0.0489926 | 0.0482035 | 0.0507950 | 0.071571 |
| 2 | colWeightedMeans(X, w, rows, cols) | 0.059721 | 0.0629235 | 0.0670458 | 0.0659185 | 0.0704320 | 0.082601 |
| expr | min | lq | mean | median | uq | max | |
|---|---|---|---|---|---|---|---|
| 1 | colWeightedMeans_X_w_S | 1.000000 | 1.000000 | 1.000000 | 1.000000 | 1.000000 | 1.0000000 |
| 3 | colWeightedMeans(X[rows, cols], w[rows]) | 1.678540 | 1.665889 | 1.641693 | 1.681615 | 1.667296 | 0.8167129 |
| 2 | colWeightedMeans(X, w, rows, cols) | 2.348077 | 2.276867 | 2.246636 | 2.299616 | 2.311861 | 0.9425787 |
Table: Benchmarking of rowWeightedMeans_X_w_S(), rowWeightedMeans(X, w, cols, rows)() and rowWeightedMeans(X[cols, rows], w[rows])() on 10x1000 data (transposed). The top panel shows times in milliseconds and the bottom panel shows relative times.
| expr | min | lq | mean | median | uq | max | |
|---|---|---|---|---|---|---|---|
| 1 | rowWeightedMeans_X_w_S | 0.076745 | 0.0814795 | 0.0895641 | 0.0873135 | 0.0987510 | 0.111963 |
| 3 | rowWeightedMeans(X[cols, rows], w[rows]) | 0.089764 | 0.0956705 | 0.1036479 | 0.0999265 | 0.1101905 | 0.146547 |
| 2 | rowWeightedMeans(X, w, cols, rows) | 0.102693 | 0.1097590 | 0.1194334 | 0.1141985 | 0.1261720 | 0.217841 |
| expr | min | lq | mean | median | uq | max | |
|---|---|---|---|---|---|---|---|
| 1 | rowWeightedMeans_X_w_S | 1.000000 | 1.000000 | 1.000000 | 1.000000 | 1.000000 | 1.000000 |
| 3 | rowWeightedMeans(X[cols, rows], w[rows]) | 1.169640 | 1.174166 | 1.157248 | 1.144456 | 1.115842 | 1.308888 |
| 2 | rowWeightedMeans(X, w, cols, rows) | 1.338107 | 1.347075 | 1.333496 | 1.307913 | 1.277678 | 1.945652 |
Figure: Benchmarking of colWeightedMeans_X_w_S(), colWeightedMeans(X, w, rows, cols)() and colWeightedMeans(X[rows, cols], w[rows])() on 10x1000 data as well as rowWeightedMeans_X_w_S(), rowWeightedMeans(X, w, cols, rows)() and rowWeightedMeans(X[cols, rows], w[rows])() on the same data transposed. Outliers are displayed as crosses. Times are in milliseconds.
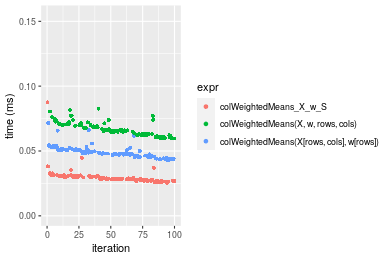
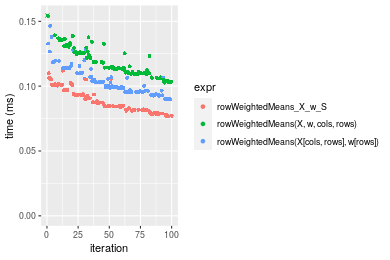 Table: Benchmarking of colWeightedMeans_X_w_S() and rowWeightedMeans_X_w_S() on 10x1000 data (original and transposed). The top panel shows times in milliseconds and the bottom panel shows relative times.
| expr | min | lq | mean | median | uq | max | |
|---|---|---|---|---|---|---|---|
| 1 | colWeightedMeans_X_w_S | 25.434 | 27.6360 | 29.84274 | 28.6650 | 30.4655 | 87.633 |
| 2 | rowWeightedMeans_X_w_S | 76.745 | 81.4795 | 89.56411 | 87.3135 | 98.7510 | 111.963 |
| expr | min | lq | mean | median | uq | max | |
|---|---|---|---|---|---|---|---|
| 1 | colWeightedMeans_X_w_S | 1.000000 | 1.00000 | 1.000000 | 1.000000 | 1.000000 | 1.000000 |
| 2 | rowWeightedMeans_X_w_S | 3.017418 | 2.94831 | 3.001203 | 3.045997 | 3.241404 | 1.277635 |
Figure: Benchmarking of colWeightedMeans_X_w_S() and rowWeightedMeans_X_w_S() on 10x1000 data (original and transposed). Outliers are displayed as crosses. Times are in milliseconds.
100x1000 matrix
> X <- data[["100x1000"]]
> rows <- sample.int(nrow(X), size = nrow(X) * 0.7)
> cols <- sample.int(ncol(X), size = ncol(X) * 0.7)
> X_S <- X[rows, cols]
> w <- runif(nrow(X))
> w_S <- w[rows]
> gc()
           used  (Mb) gc trigger  (Mb) max used  (Mb)
Ncells  5316317 284.0    8529671 455.6  8529671 455.6
Vcells 10447216  79.8   31876688 243.2 60562128 462.1
> colStats <- microbenchmark(colWeightedMeans_X_w_S = colWeightedMeans(X_S, w = w_S, na.rm = FALSE),
+     `colWeightedMeans(X, w, rows, cols)` = colWeightedMeans(X, w = w, rows = rows, cols = cols, na.rm = FALSE),
+     `colWeightedMeans(X[rows, cols], w[rows])` = colWeightedMeans(X[rows, cols], w = w[rows], na.rm = FALSE),
+     unit = "ms")
> X <- t(X)
> X_S <- t(X_S)
> gc()
           used  (Mb) gc trigger  (Mb) max used  (Mb)
Ncells  5316293 284.0    8529671 455.6  8529671 455.6
Vcells 10547269  80.5   31876688 243.2 60562128 462.1
> rowStats <- microbenchmark(rowWeightedMeans_X_w_S = rowWeightedMeans(X_S, w = w_S, na.rm = FALSE),
+     `rowWeightedMeans(X, w, cols, rows)` = rowWeightedMeans(X, w = w, rows = cols, cols = rows, na.rm = FALSE),
+     `rowWeightedMeans(X[cols, rows], w[rows])` = rowWeightedMeans(X[cols, rows], w = w[rows], na.rm = FALSE),
+     unit = "ms")
Table: Benchmarking of colWeightedMeans_X_w_S(), colWeightedMeans(X, w, rows, cols)() and colWeightedMeans(X[rows, cols], w[rows])() on 100x1000 data. The top panel shows times in milliseconds and the bottom panel shows relative times.
| expr | min | lq | mean | median | uq | max | |
|---|---|---|---|---|---|---|---|
| 1 | colWeightedMeans_X_w_S | 0.106340 | 0.1185155 | 0.1612415 | 0.1333310 | 0.209307 | 0.255349 |
| 3 | colWeightedMeans(X[rows, cols], w[rows]) | 0.217438 | 0.2423745 | 0.3942446 | 0.2772740 | 0.407768 | 7.571224 |
| 2 | colWeightedMeans(X, w, rows, cols) | 0.327660 | 0.3694830 | 0.4984764 | 0.4426665 | 0.623788 | 0.753719 |
| expr | min | lq | mean | median | uq | max | |
|---|---|---|---|---|---|---|---|
| 1 | colWeightedMeans_X_w_S | 1.000000 | 1.000000 | 1.000000 | 1.000000 | 1.000000 | 1.000000 |
| 3 | colWeightedMeans(X[rows, cols], w[rows]) | 2.044743 | 2.045087 | 2.445056 | 2.079591 | 1.948181 | 29.650494 |
| 2 | colWeightedMeans(X, w, rows, cols) | 3.081249 | 3.117592 | 3.091489 | 3.320057 | 2.980254 | 2.951721 |
Table: Benchmarking of rowWeightedMeans_X_w_S(), rowWeightedMeans(X, w, cols, rows)() and rowWeightedMeans(X[cols, rows], w[rows])() on 100x1000 data (transposed). The top panel shows times in milliseconds and the bottom panel shows relative times.
| expr | min | lq | mean | median | uq | max | |
|---|---|---|---|---|---|---|---|
| 1 | rowWeightedMeans_X_w_S | 0.520571 | 0.5660945 | 0.6241448 | 0.6404850 | 0.662353 | 0.914939 |
| 3 | rowWeightedMeans(X[cols, rows], w[rows]) | 0.615246 | 0.6881895 | 0.8508142 | 0.8335270 | 0.873567 | 7.374503 |
| 2 | rowWeightedMeans(X, w, cols, rows) | 0.708871 | 0.7555170 | 0.9091993 | 0.8707455 | 1.063113 | 1.679352 |
| expr | min | lq | mean | median | uq | max | |
|---|---|---|---|---|---|---|---|
| 1 | rowWeightedMeans_X_w_S | 1.000000 | 1.000000 | 1.000000 | 1.00000 | 1.000000 | 1.000000 |
| 3 | rowWeightedMeans(X[cols, rows], w[rows]) | 1.181868 | 1.215680 | 1.363168 | 1.30140 | 1.318884 | 8.060104 |
| 2 | rowWeightedMeans(X, w, cols, rows) | 1.361718 | 1.334613 | 1.456712 | 1.35951 | 1.605055 | 1.835480 |
Figure: Benchmarking of colWeightedMeans_X_w_S(), colWeightedMeans(X, w, rows, cols)() and colWeightedMeans(X[rows, cols], w[rows])() on 100x1000 data as well as rowWeightedMeans_X_w_S(), rowWeightedMeans(X, w, cols, rows)() and rowWeightedMeans(X[cols, rows], w[rows])() on the same data transposed. Outliers are displayed as crosses. Times are in milliseconds.
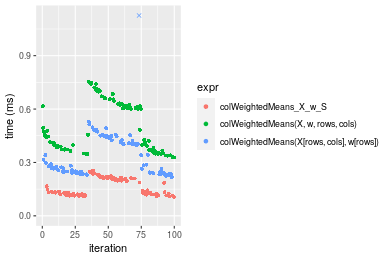
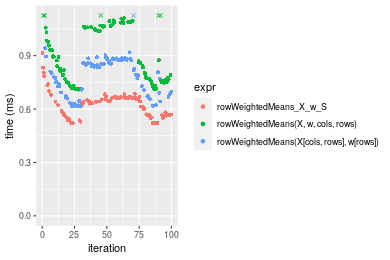 Table: Benchmarking of colWeightedMeans_X_w_S() and rowWeightedMeans_X_w_S() on 100x1000 data (original and transposed). The top panel shows times in milliseconds and the bottom panel shows relative times.
| expr | min | lq | mean | median | uq | max | |
|---|---|---|---|---|---|---|---|
| 1 | colWeightedMeans_X_w_S | 106.340 | 118.5155 | 161.2415 | 133.331 | 209.307 | 255.349 |
| 2 | rowWeightedMeans_X_w_S | 520.571 | 566.0945 | 624.1448 | 640.485 | 662.353 | 914.939 |
| expr | min | lq | mean | median | uq | max | |
|---|---|---|---|---|---|---|---|
| 1 | colWeightedMeans_X_w_S | 1.000000 | 1.000000 | 1.000000 | 1.000000 | 1.000000 | 1.000000 |
| 2 | rowWeightedMeans_X_w_S | 4.895345 | 4.776544 | 3.870869 | 4.803722 | 3.164505 | 3.583092 |
Figure: Benchmarking of colWeightedMeans_X_w_S() and rowWeightedMeans_X_w_S() on 100x1000 data (original and transposed). Outliers are displayed as crosses. Times are in milliseconds.
1000x100 matrix
> X <- data[["1000x100"]]
> rows <- sample.int(nrow(X), size = nrow(X) * 0.7)
> cols <- sample.int(ncol(X), size = ncol(X) * 0.7)
> X_S <- X[rows, cols]
> w <- runif(nrow(X))
> w_S <- w[rows]
> gc()
           used  (Mb) gc trigger  (Mb) max used  (Mb)
Ncells  5316523 284.0    8529671 455.6  8529671 455.6
Vcells 10449530  79.8   31876688 243.2 60562128 462.1
> colStats <- microbenchmark(colWeightedMeans_X_w_S = colWeightedMeans(X_S, w = w_S, na.rm = FALSE),
+     `colWeightedMeans(X, w, rows, cols)` = colWeightedMeans(X, w = w, rows = rows, cols = cols, na.rm = FALSE),
+     `colWeightedMeans(X[rows, cols], w[rows])` = colWeightedMeans(X[rows, cols], w = w[rows], na.rm = FALSE),
+     unit = "ms")
> X <- t(X)
> X_S <- t(X_S)
> gc()
           used  (Mb) gc trigger  (Mb) max used  (Mb)
Ncells  5316499 284.0    8529671 455.6  8529671 455.6
Vcells 10549583  80.5   31876688 243.2 60562128 462.1
> rowStats <- microbenchmark(rowWeightedMeans_X_w_S = rowWeightedMeans(X_S, w = w_S, na.rm = FALSE),
+     `rowWeightedMeans(X, w, cols, rows)` = rowWeightedMeans(X, w = w, rows = cols, cols = rows, na.rm = FALSE),
+     `rowWeightedMeans(X[cols, rows], w[rows])` = rowWeightedMeans(X[cols, rows], w = w[rows], na.rm = FALSE),
+     unit = "ms")
Table: Benchmarking of colWeightedMeans_X_w_S(), colWeightedMeans(X, w, rows, cols)() and colWeightedMeans(X[rows, cols], w[rows])() on 1000x100 data. The top panel shows times in milliseconds and the bottom panel shows relative times.
| expr | min | lq | mean | median | uq | max | |
|---|---|---|---|---|---|---|---|
| 1 | colWeightedMeans_X_w_S | 0.120831 | 0.1370030 | 0.2733699 | 0.1560125 | 0.2223970 | 9.749359 |
| 3 | colWeightedMeans(X[rows, cols], w[rows]) | 0.225285 | 0.2533300 | 0.3292349 | 0.2750685 | 0.4232845 | 0.506218 |
| 2 | colWeightedMeans(X, w, rows, cols) | 0.340978 | 0.3814945 | 0.4961101 | 0.4280290 | 0.6227120 | 0.774496 |
| expr | min | lq | mean | median | uq | max | |
|---|---|---|---|---|---|---|---|
| 1 | colWeightedMeans_X_w_S | 1.000000 | 1.000000 | 1.000000 | 1.000000 | 1.000000 | 1.0000000 |
| 3 | colWeightedMeans(X[rows, cols], w[rows]) | 1.864464 | 1.849084 | 1.204357 | 1.763118 | 1.903283 | 0.0519232 |
| 2 | colWeightedMeans(X, w, rows, cols) | 2.821941 | 2.784570 | 1.814794 | 2.743556 | 2.800002 | 0.0794407 |
Table: Benchmarking of rowWeightedMeans_X_w_S(), rowWeightedMeans(X, w, cols, rows)() and rowWeightedMeans(X[cols, rows], w[rows])() on 1000x100 data (transposed). The top panel shows times in milliseconds and the bottom panel shows relative times.
| expr | min | lq | mean | median | uq | max | |
|---|---|---|---|---|---|---|---|
| 1 | rowWeightedMeans_X_w_S | 0.531949 | 0.581315 | 0.6366792 | 0.6513065 | 0.678086 | 0.858844 |
| 3 | rowWeightedMeans(X[cols, rows], w[rows]) | 0.630222 | 0.666732 | 0.7631659 | 0.7252330 | 0.870224 | 0.973034 |
| 2 | rowWeightedMeans(X, w, cols, rows) | 0.729379 | 0.784328 | 1.0072290 | 0.9201865 | 1.107291 | 7.697569 |
| expr | min | lq | mean | median | uq | max | |
|---|---|---|---|---|---|---|---|
| 1 | rowWeightedMeans_X_w_S | 1.000000 | 1.000000 | 1.000000 | 1.000000 | 1.000000 | 1.000000 |
| 3 | rowWeightedMeans(X[cols, rows], w[rows]) | 1.184741 | 1.146937 | 1.198666 | 1.113505 | 1.283353 | 1.132958 |
| 2 | rowWeightedMeans(X, w, cols, rows) | 1.371145 | 1.349231 | 1.582004 | 1.412832 | 1.632965 | 8.962709 |
Figure: Benchmarking of colWeightedMeans_X_w_S(), colWeightedMeans(X, w, rows, cols)() and colWeightedMeans(X[rows, cols], w[rows])() on 1000x100 data as well as rowWeightedMeans_X_w_S(), rowWeightedMeans(X, w, cols, rows)() and rowWeightedMeans(X[cols, rows], w[rows])() on the same data transposed. Outliers are displayed as crosses. Times are in milliseconds.
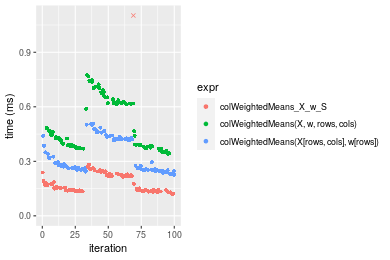
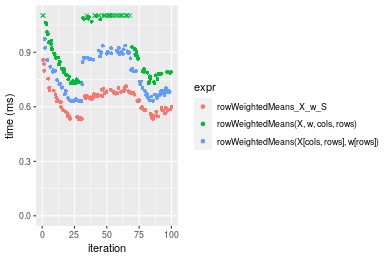 Table: Benchmarking of colWeightedMeans_X_w_S() and rowWeightedMeans_X_w_S() on 1000x100 data (original and transposed). The top panel shows times in milliseconds and the bottom panel shows relative times.
| expr | min | lq | mean | median | uq | max | |
|---|---|---|---|---|---|---|---|
| 1 | colWeightedMeans_X_w_S | 120.831 | 137.003 | 273.3699 | 156.0125 | 222.397 | 9749.359 |
| 2 | rowWeightedMeans_X_w_S | 531.949 | 581.315 | 636.6792 | 651.3065 | 678.086 | 858.844 |
| expr | min | lq | mean | median | uq | max | |
|---|---|---|---|---|---|---|---|
| 1 | colWeightedMeans_X_w_S | 1.000000 | 1.000000 | 1.000000 | 1.000000 | 1.000000 | 1.0000000 |
| 2 | rowWeightedMeans_X_w_S | 4.402422 | 4.243082 | 2.329002 | 4.174707 | 3.048989 | 0.0880924 |
Figure: Benchmarking of colWeightedMeans_X_w_S() and rowWeightedMeans_X_w_S() on 1000x100 data (original and transposed). Outliers are displayed as crosses. Times are in milliseconds.
Appendix
Session information
R version 4.1.1 Patched (2021-08-10 r80727)
Platform: x86_64-pc-linux-gnu (64-bit)
Running under: Ubuntu 18.04.5 LTS

Matrix products: default
BLAS:   /home/hb/software/R-devel/R-4-1-branch/lib/R/lib/libRblas.so
LAPACK: /home/hb/software/R-devel/R-4-1-branch/lib/R/lib/libRlapack.so

locale:
 [1] LC_CTYPE=en_US.UTF-8       LC_NUMERIC=C
 [3] LC_TIME=en_US.UTF-8        LC_COLLATE=en_US.UTF-8
 [5] LC_MONETARY=en_US.UTF-8    LC_MESSAGES=en_US.UTF-8
 [7] LC_PAPER=en_US.UTF-8       LC_NAME=C
 [9] LC_ADDRESS=C               LC_TELEPHONE=C
[11] LC_MEASUREMENT=en_US.UTF-8 LC_IDENTIFICATION=C

attached base packages:
[1] stats     graphics  grDevices utils     datasets  methods   base

other attached packages:
[1] microbenchmark_1.4-7   matrixStats_0.60.1     ggplot2_3.3.5
[4] knitr_1.33             R.devices_2.17.0       R.utils_2.10.1
[7] R.oo_1.24.0            R.methodsS3_1.8.1-9001 history_0.0.1-9000

loaded via a namespace (and not attached):
 [1] Biobase_2.52.0          httr_1.4.2              splines_4.1.1
 [4] bit64_4.0.5             network_1.17.1          assertthat_0.2.1
 [7] highr_0.9               stats4_4.1.1            blob_1.2.2
[10] GenomeInfoDbData_1.2.6  robustbase_0.93-8       pillar_1.6.2
[13] RSQLite_2.2.8           lattice_0.20-44         glue_1.4.2
[16] digest_0.6.27           XVector_0.32.0          colorspace_2.0-2
[19] Matrix_1.3-4            XML_3.99-0.7            pkgconfig_2.0.3
[22] zlibbioc_1.38.0         genefilter_1.74.0       purrr_0.3.4
[25] ergm_4.1.2              xtable_1.8-4            scales_1.1.1
[28] tibble_3.1.4            annotate_1.70.0         KEGGREST_1.32.0
[31] farver_2.1.0            generics_0.1.0          IRanges_2.26.0
[34] ellipsis_0.3.2          cachem_1.0.6            withr_2.4.2
[37] BiocGenerics_0.38.0     mime_0.11               survival_3.2-13
[40] magrittr_2.0.1          crayon_1.4.1            statnet.common_4.5.0
[43] memoise_2.0.0           laeken_0.5.1            fansi_0.5.0
[46] R.cache_0.15.0          MASS_7.3-54             R.rsp_0.44.0
[49] progressr_0.8.0         tools_4.1.1             lifecycle_1.0.0
[52] S4Vectors_0.30.0        trust_0.1-8             munsell_0.5.0
[55] tabby_0.0.1-9001        AnnotationDbi_1.54.1    Biostrings_2.60.2
[58] compiler_4.1.1          GenomeInfoDb_1.28.1     rlang_0.4.11
[61] grid_4.1.1              RCurl_1.98-1.4          cwhmisc_6.6
[64] rappdirs_0.3.3          startup_0.15.0          labeling_0.4.2
[67] bitops_1.0-7            base64enc_0.1-3         boot_1.3-28
[70] gtable_0.3.0            DBI_1.1.1               markdown_1.1
[73] R6_2.5.1                lpSolveAPI_5.5.2.0-17.7 rle_0.9.2
[76] dplyr_1.0.7             fastmap_1.1.0           bit_4.0.4
[79] utf8_1.2.2              parallel_4.1.1          Rcpp_1.0.7
[82] vctrs_0.3.8             png_0.1-7               DEoptimR_1.0-9
[85] tidyselect_1.1.1        xfun_0.25               coda_0.19-4
Total processing time was 12.35 secs.
Reproducibility
To reproduce this report, do:
html <- matrixStats:::benchmark('colRowWeightedMeans_subset')
Copyright Dongcan Jiang. Last updated on 2021-08-25 19:11:23 (+0200 UTC). Powered by RSP.