matrixStats.benchmarks
colTabulates() and rowTabulates() benchmarks on subsetted computation
This report benchmark the performance of colTabulates() and rowTabulates() on subsetted computation.
Data
> rmatrix <- function(nrow, ncol, mode = c("logical", "double", "integer", "index"), range = c(-100,
+     +100), na_prob = 0) {
+     mode <- match.arg(mode)
+     n <- nrow * ncol
+     if (mode == "logical") {
+         x <- sample(c(FALSE, TRUE), size = n, replace = TRUE)
+     }     else if (mode == "index") {
+         x <- seq_len(n)
+         mode <- "integer"
+     }     else {
+         x <- runif(n, min = range[1], max = range[2])
+     }
+     storage.mode(x) <- mode
+     if (na_prob > 0)
+         x[sample(n, size = na_prob * n)] <- NA
+     dim(x) <- c(nrow, ncol)
+     x
+ }
> rmatrices <- function(scale = 10, seed = 1, ...) {
+     set.seed(seed)
+     data <- list()
+     data[[1]] <- rmatrix(nrow = scale * 1, ncol = scale * 1, ...)
+     data[[2]] <- rmatrix(nrow = scale * 10, ncol = scale * 10, ...)
+     data[[3]] <- rmatrix(nrow = scale * 100, ncol = scale * 1, ...)
+     data[[4]] <- t(data[[3]])
+     data[[5]] <- rmatrix(nrow = scale * 10, ncol = scale * 100, ...)
+     data[[6]] <- t(data[[5]])
+     names(data) <- sapply(data, FUN = function(x) paste(dim(x), collapse = "x"))
+     data
+ }
> data <- rmatrices(mode = "integer", range = c(-10, 10))
Results
10x10 matrix
> X <- data[["10x10"]]
> rows <- sample.int(nrow(X), size = nrow(X) * 0.7)
> cols <- sample.int(ncol(X), size = ncol(X) * 0.7)
> X_S <- X[rows, cols]
> gc()
           used  (Mb) gc trigger  (Mb) max used  (Mb)
Ncells  5307356 283.5    8529671 455.6  8529671 455.6
Vcells 10520452  80.3   31876688 243.2 60562128 462.1
> colStats <- microbenchmark(colTabulates_X_S = colTabulates(X_S, na.rm = FALSE), `colTabulates(X, rows, cols)` = colTabulates(X,
+     rows = rows, cols = cols, na.rm = FALSE), `colTabulates(X[rows, cols])` = colTabulates(X[rows,
+     cols], na.rm = FALSE), unit = "ms")
> X <- t(X)
> X_S <- t(X_S)
> gc()
           used  (Mb) gc trigger  (Mb) max used  (Mb)
Ncells  5298014 283.0    8529671 455.6  8529671 455.6
Vcells 10489498  80.1   31876688 243.2 60562128 462.1
> rowStats <- microbenchmark(rowTabulates_X_S = rowTabulates(X_S, na.rm = FALSE), `rowTabulates(X, cols, rows)` = rowTabulates(X,
+     rows = cols, cols = rows, na.rm = FALSE), `rowTabulates(X[cols, rows])` = rowTabulates(X[cols,
+     rows], na.rm = FALSE), unit = "ms")
Table: Benchmarking of colTabulates_X_S(), colTabulates(X, rows, cols)() and colTabulates(X[rows, cols])() on 10x10 data. The top panel shows times in milliseconds and the bottom panel shows relative times.
| expr | min | lq | mean | median | uq | max | |
|---|---|---|---|---|---|---|---|
| 3 | colTabulates(X[rows, cols]) | 0.146006 | 0.1549780 | 0.1743222 | 0.169301 | 0.1861495 | 0.245342 |
| 2 | colTabulates(X, rows, cols) | 0.144400 | 0.1566310 | 0.1789456 | 0.174054 | 0.1905680 | 0.252232 |
| 1 | colTabulates_X_S | 0.145334 | 0.1565155 | 0.1817853 | 0.177237 | 0.1906800 | 0.648597 |
| expr | min | lq | mean | median | uq | max | |
|---|---|---|---|---|---|---|---|
| 3 | colTabulates(X[rows, cols]) | 1.0000000 | 1.000000 | 1.000000 | 1.000000 | 1.000000 | 1.000000 |
| 2 | colTabulates(X, rows, cols) | 0.9890005 | 1.010666 | 1.026522 | 1.028074 | 1.023736 | 1.028083 |
| 1 | colTabulates_X_S | 0.9953974 | 1.009921 | 1.042812 | 1.046875 | 1.024338 | 2.643644 |
Table: Benchmarking of rowTabulates_X_S(), rowTabulates(X, cols, rows)() and rowTabulates(X[cols, rows])() on 10x10 data (transposed). The top panel shows times in milliseconds and the bottom panel shows relative times.
| expr | min | lq | mean | median | uq | max | |
|---|---|---|---|---|---|---|---|
| 3 | rowTabulates(X[cols, rows]) | 0.133789 | 0.1449595 | 0.1585527 | 0.1565320 | 0.1667900 | 0.206230 |
| 2 | rowTabulates(X, cols, rows) | 0.133759 | 0.1442980 | 0.1694581 | 0.1612490 | 0.1778005 | 0.686733 |
| 1 | rowTabulates_X_S | 0.132664 | 0.1423310 | 0.1640924 | 0.1619795 | 0.1810535 | 0.236404 |
| expr | min | lq | mean | median | uq | max | |
|---|---|---|---|---|---|---|---|
| 3 | rowTabulates(X[cols, rows]) | 1.0000000 | 1.0000000 | 1.000000 | 1.000000 | 1.000000 | 1.000000 |
| 2 | rowTabulates(X, cols, rows) | 0.9997758 | 0.9954367 | 1.068781 | 1.030134 | 1.066014 | 3.329937 |
| 1 | rowTabulates_X_S | 0.9915912 | 0.9818673 | 1.034939 | 1.034801 | 1.085518 | 1.146312 |
Figure: Benchmarking of colTabulates_X_S(), colTabulates(X, rows, cols)() and colTabulates(X[rows, cols])() on 10x10 data as well as rowTabulates_X_S(), rowTabulates(X, cols, rows)() and rowTabulates(X[cols, rows])() on the same data transposed. Outliers are displayed as crosses. Times are in milliseconds.
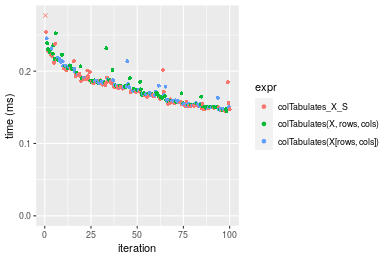
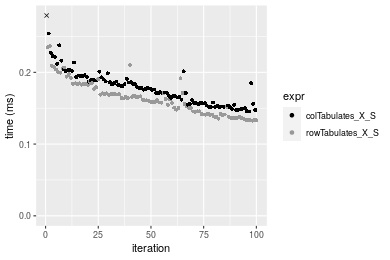
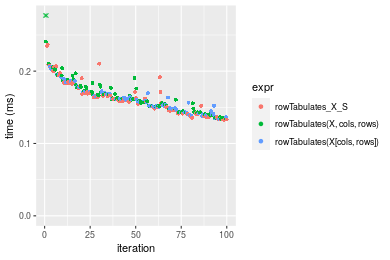 Table: Benchmarking of colTabulates_X_S() and rowTabulates_X_S() on 10x10 data (original and transposed). The top panel shows times in milliseconds and the bottom panel shows relative times.
| expr | min | lq | mean | median | uq | max | |
|---|---|---|---|---|---|---|---|
| 2 | rowTabulates_X_S | 132.664 | 142.3310 | 164.0924 | 161.9795 | 181.0535 | 236.404 |
| 1 | colTabulates_X_S | 145.334 | 156.5155 | 181.7853 | 177.2370 | 190.6800 | 648.597 |
| expr | min | lq | mean | median | uq | max | |
|---|---|---|---|---|---|---|---|
| 2 | rowTabulates_X_S | 1.000000 | 1.000000 | 1.000000 | 1.000000 | 1.000000 | 1.000000 |
| 1 | colTabulates_X_S | 1.095504 | 1.099659 | 1.107823 | 1.094194 | 1.053169 | 2.743596 |
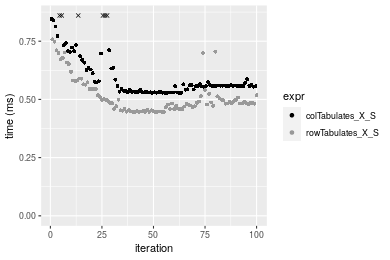
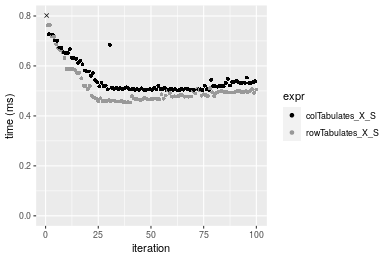
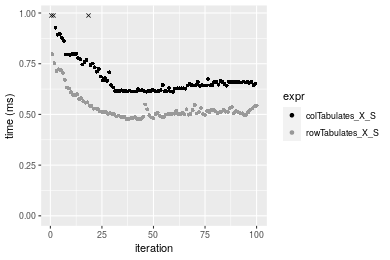
Figure: Benchmarking of colTabulates_X_S() and rowTabulates_X_S() on 10x10 data (original and transposed). Outliers are displayed as crosses. Times are in milliseconds.
100x100 matrix
> X <- data[["100x100"]]
> rows <- sample.int(nrow(X), size = nrow(X) * 0.7)
> cols <- sample.int(ncol(X), size = ncol(X) * 0.7)
> X_S <- X[rows, cols]
> gc()
           used  (Mb) gc trigger  (Mb) max used  (Mb)
Ncells  5297057 282.9    8529671 455.6  8529671 455.6
Vcells 10158796  77.6   31876688 243.2 60562128 462.1
> colStats <- microbenchmark(colTabulates_X_S = colTabulates(X_S, na.rm = FALSE), `colTabulates(X, rows, cols)` = colTabulates(X,
+     rows = rows, cols = cols, na.rm = FALSE), `colTabulates(X[rows, cols])` = colTabulates(X[rows,
+     cols], na.rm = FALSE), unit = "ms")
> X <- t(X)
> X_S <- t(X_S)
> gc()
           used  (Mb) gc trigger  (Mb) max used  (Mb)
Ncells  5297051 282.9    8529671 455.6  8529671 455.6
Vcells 10163879  77.6   31876688 243.2 60562128 462.1
> rowStats <- microbenchmark(rowTabulates_X_S = rowTabulates(X_S, na.rm = FALSE), `rowTabulates(X, cols, rows)` = rowTabulates(X,
+     rows = cols, cols = rows, na.rm = FALSE), `rowTabulates(X[cols, rows])` = rowTabulates(X[cols,
+     rows], na.rm = FALSE), unit = "ms")
Table: Benchmarking of colTabulates_X_S(), colTabulates(X, rows, cols)() and colTabulates(X[rows, cols])() on 100x100 data. The top panel shows times in milliseconds and the bottom panel shows relative times.
| expr | min | lq | mean | median | uq | max | |
|---|---|---|---|---|---|---|---|
| 1 | colTabulates_X_S | 0.528188 | 0.5343465 | 0.6145483 | 0.5581070 | 0.6305655 | 1.308660 |
| 2 | colTabulates(X, rows, cols) | 0.533623 | 0.5428890 | 0.6091560 | 0.5665730 | 0.5977135 | 1.226304 |
| 3 | colTabulates(X[rows, cols]) | 0.536044 | 0.5494590 | 0.6072853 | 0.5683125 | 0.6354870 | 1.047434 |
| expr | min | lq | mean | median | uq | max | |
|---|---|---|---|---|---|---|---|
| 1 | colTabulates_X_S | 1.000000 | 1.000000 | 1.0000000 | 1.000000 | 1.0000000 | 1.0000000 |
| 2 | colTabulates(X, rows, cols) | 1.010290 | 1.015987 | 0.9912256 | 1.015169 | 0.9479007 | 0.9370685 |
| 3 | colTabulates(X[rows, cols]) | 1.014873 | 1.028282 | 0.9881816 | 1.018286 | 1.0078049 | 0.8003867 |
Table: Benchmarking of rowTabulates_X_S(), rowTabulates(X, cols, rows)() and rowTabulates(X[cols, rows])() on 100x100 data (transposed). The top panel shows times in milliseconds and the bottom panel shows relative times.
| expr | min | lq | mean | median | uq | max | |
|---|---|---|---|---|---|---|---|
| 1 | rowTabulates_X_S | 0.445811 | 0.4591320 | 0.5126705 | 0.4844505 | 0.5325675 | 0.757621 |
| 3 | rowTabulates(X[cols, rows]) | 0.453302 | 0.4667415 | 0.5072105 | 0.4896350 | 0.5136450 | 0.821060 |
| 2 | rowTabulates(X, cols, rows) | 0.454507 | 0.4664980 | 0.5144699 | 0.4929205 | 0.5136540 | 0.908380 |
| expr | min | lq | mean | median | uq | max | |
|---|---|---|---|---|---|---|---|
| 1 | rowTabulates_X_S | 1.000000 | 1.000000 | 1.0000000 | 1.000000 | 1.0000000 | 1.000000 |
| 3 | rowTabulates(X[cols, rows]) | 1.016803 | 1.016574 | 0.9893498 | 1.010702 | 0.9644693 | 1.083735 |
| 2 | rowTabulates(X, cols, rows) | 1.019506 | 1.016043 | 1.0035098 | 1.017484 | 0.9644862 | 1.198990 |
Figure: Benchmarking of colTabulates_X_S(), colTabulates(X, rows, cols)() and colTabulates(X[rows, cols])() on 100x100 data as well as rowTabulates_X_S(), rowTabulates(X, cols, rows)() and rowTabulates(X[cols, rows])() on the same data transposed. Outliers are displayed as crosses. Times are in milliseconds.
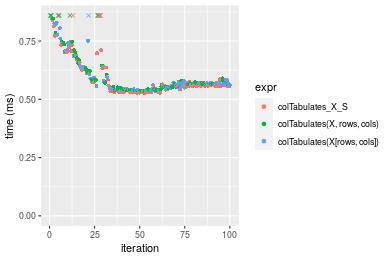
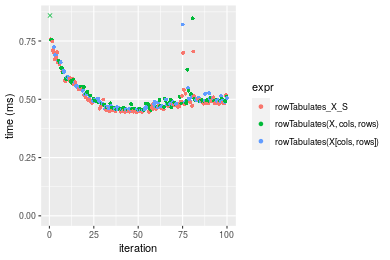 Table: Benchmarking of colTabulates_X_S() and rowTabulates_X_S() on 100x100 data (original and transposed). The top panel shows times in milliseconds and the bottom panel shows relative times.
| expr | min | lq | mean | median | uq | max | |
|---|---|---|---|---|---|---|---|
| 2 | rowTabulates_X_S | 445.811 | 459.1320 | 512.6705 | 484.4505 | 532.5675 | 757.621 |
| 1 | colTabulates_X_S | 528.188 | 534.3465 | 614.5483 | 558.1070 | 630.5655 | 1308.660 |
| expr | min | lq | mean | median | uq | max | |
|---|---|---|---|---|---|---|---|
| 2 | rowTabulates_X_S | 1.00000 | 1.000000 | 1.00000 | 1.000000 | 1.000000 | 1.000000 |
| 1 | colTabulates_X_S | 1.18478 | 1.163819 | 1.19872 | 1.152041 | 1.184011 | 1.727328 |
Figure: Benchmarking of colTabulates_X_S() and rowTabulates_X_S() on 100x100 data (original and transposed). Outliers are displayed as crosses. Times are in milliseconds.
1000x10 matrix
> X <- data[["1000x10"]]
> rows <- sample.int(nrow(X), size = nrow(X) * 0.7)
> cols <- sample.int(ncol(X), size = ncol(X) * 0.7)
> X_S <- X[rows, cols]
> gc()
           used  (Mb) gc trigger  (Mb) max used  (Mb)
Ncells  5297799 283.0    8529671 455.6  8529671 455.6
Vcells 10162844  77.6   31876688 243.2 60562128 462.1
> colStats <- microbenchmark(colTabulates_X_S = colTabulates(X_S, na.rm = FALSE), `colTabulates(X, rows, cols)` = colTabulates(X,
+     rows = rows, cols = cols, na.rm = FALSE), `colTabulates(X[rows, cols])` = colTabulates(X[rows,
+     cols], na.rm = FALSE), unit = "ms")
> X <- t(X)
> X_S <- t(X_S)
> gc()
           used  (Mb) gc trigger  (Mb) max used  (Mb)
Ncells  5297793 283.0    8529671 455.6  8529671 455.6
Vcells 10167927  77.6   31876688 243.2 60562128 462.1
> rowStats <- microbenchmark(rowTabulates_X_S = rowTabulates(X_S, na.rm = FALSE), `rowTabulates(X, cols, rows)` = rowTabulates(X,
+     rows = cols, cols = rows, na.rm = FALSE), `rowTabulates(X[cols, rows])` = rowTabulates(X[cols,
+     rows], na.rm = FALSE), unit = "ms")
Table: Benchmarking of colTabulates_X_S(), colTabulates(X, rows, cols)() and colTabulates(X[rows, cols])() on 1000x10 data. The top panel shows times in milliseconds and the bottom panel shows relative times.
| expr | min | lq | mean | median | uq | max | |
|---|---|---|---|---|---|---|---|
| 1 | colTabulates_X_S | 0.501483 | 0.5066535 | 0.5491016 | 0.5190530 | 0.551030 | 0.848530 |
| 2 | colTabulates(X, rows, cols) | 0.510913 | 0.5170600 | 0.5570209 | 0.5354355 | 0.555112 | 0.861095 |
| 3 | colTabulates(X[rows, cols]) | 0.511303 | 0.5180255 | 0.5610530 | 0.5410255 | 0.556660 | 0.992129 |
| expr | min | lq | mean | median | uq | max | |
|---|---|---|---|---|---|---|---|
| 1 | colTabulates_X_S | 1.000000 | 1.000000 | 1.000000 | 1.000000 | 1.000000 | 1.000000 |
| 2 | colTabulates(X, rows, cols) | 1.018804 | 1.020540 | 1.014422 | 1.031562 | 1.007408 | 1.014808 |
| 3 | colTabulates(X[rows, cols]) | 1.019582 | 1.022445 | 1.021765 | 1.042332 | 1.010217 | 1.169233 |
Table: Benchmarking of rowTabulates_X_S(), rowTabulates(X, cols, rows)() and rowTabulates(X[cols, rows])() on 1000x10 data (transposed). The top panel shows times in milliseconds and the bottom panel shows relative times.
| expr | min | lq | mean | median | uq | max | |
|---|---|---|---|---|---|---|---|
| 1 | rowTabulates_X_S | 0.453391 | 0.468652 | 0.5087078 | 0.4862890 | 0.5043310 | 0.764466 |
| 3 | rowTabulates(X[cols, rows]) | 0.463655 | 0.478666 | 0.5153285 | 0.5030950 | 0.5172885 | 0.913869 |
| 2 | rowTabulates(X, cols, rows) | 0.464519 | 0.480394 | 0.5176073 | 0.5042245 | 0.5305105 | 0.735568 |
| expr | min | lq | mean | median | uq | max | |
|---|---|---|---|---|---|---|---|
| 1 | rowTabulates_X_S | 1.000000 | 1.000000 | 1.000000 | 1.000000 | 1.000000 | 1.0000000 |
| 3 | rowTabulates(X[cols, rows]) | 1.022638 | 1.021368 | 1.013015 | 1.034560 | 1.025692 | 1.1954345 |
| 2 | rowTabulates(X, cols, rows) | 1.024544 | 1.025055 | 1.017494 | 1.036882 | 1.051909 | 0.9621984 |
Figure: Benchmarking of colTabulates_X_S(), colTabulates(X, rows, cols)() and colTabulates(X[rows, cols])() on 1000x10 data as well as rowTabulates_X_S(), rowTabulates(X, cols, rows)() and rowTabulates(X[cols, rows])() on the same data transposed. Outliers are displayed as crosses. Times are in milliseconds.
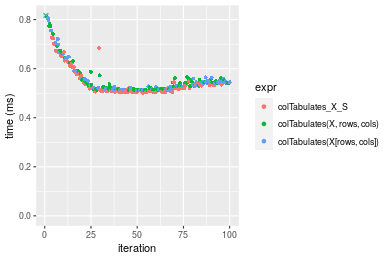
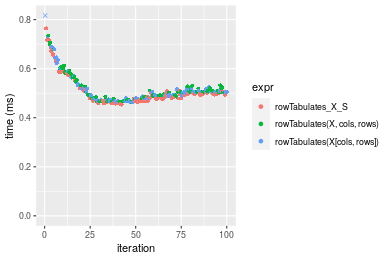 Table: Benchmarking of colTabulates_X_S() and rowTabulates_X_S() on 1000x10 data (original and transposed). The top panel shows times in milliseconds and the bottom panel shows relative times.
| expr | min | lq | mean | median | uq | max | |
|---|---|---|---|---|---|---|---|
| 2 | rowTabulates_X_S | 453.391 | 468.6520 | 508.7078 | 486.289 | 504.331 | 764.466 |
| 1 | colTabulates_X_S | 501.483 | 506.6535 | 549.1015 | 519.053 | 551.030 | 848.530 |
| expr | min | lq | mean | median | uq | max | |
|---|---|---|---|---|---|---|---|
| 2 | rowTabulates_X_S | 1.000000 | 1.000000 | 1.000000 | 1.000000 | 1.000000 | 1.000000 |
| 1 | colTabulates_X_S | 1.106072 | 1.081087 | 1.079405 | 1.067376 | 1.092596 | 1.109964 |
Figure: Benchmarking of colTabulates_X_S() and rowTabulates_X_S() on 1000x10 data (original and transposed). Outliers are displayed as crosses. Times are in milliseconds.
10x1000 matrix
> X <- data[["10x1000"]]
> rows <- sample.int(nrow(X), size = nrow(X) * 0.7)
> cols <- sample.int(ncol(X), size = ncol(X) * 0.7)
> X_S <- X[rows, cols]
> gc()
           used  (Mb) gc trigger  (Mb) max used  (Mb)
Ncells  5298004 283.0    8529671 455.6  8529671 455.6
Vcells 10163780  77.6   31876688 243.2 60562128 462.1
> colStats <- microbenchmark(colTabulates_X_S = colTabulates(X_S, na.rm = FALSE), `colTabulates(X, rows, cols)` = colTabulates(X,
+     rows = rows, cols = cols, na.rm = FALSE), `colTabulates(X[rows, cols])` = colTabulates(X[rows,
+     cols], na.rm = FALSE), unit = "ms")
> X <- t(X)
> X_S <- t(X_S)
> gc()
           used  (Mb) gc trigger  (Mb) max used  (Mb)
Ncells  5297998 283.0    8529671 455.6  8529671 455.6
Vcells 10168863  77.6   31876688 243.2 60562128 462.1
> rowStats <- microbenchmark(rowTabulates_X_S = rowTabulates(X_S, na.rm = FALSE), `rowTabulates(X, cols, rows)` = rowTabulates(X,
+     rows = cols, cols = rows, na.rm = FALSE), `rowTabulates(X[cols, rows])` = rowTabulates(X[cols,
+     rows], na.rm = FALSE), unit = "ms")
Table: Benchmarking of colTabulates_X_S(), colTabulates(X, rows, cols)() and colTabulates(X[rows, cols])() on 10x1000 data. The top panel shows times in milliseconds and the bottom panel shows relative times.
| expr | min | lq | mean | median | uq | max | |
|---|---|---|---|---|---|---|---|
| 1 | colTabulates_X_S | 0.611864 | 0.6200520 | 0.6871486 | 0.6483095 | 0.6968915 | 1.233566 |
| 3 | colTabulates(X[rows, cols]) | 0.622150 | 0.6345035 | 0.6781492 | 0.6550675 | 0.6753135 | 0.984774 |
| 2 | colTabulates(X, rows, cols) | 0.622028 | 0.6320235 | 0.6826235 | 0.6554835 | 0.6736655 | 1.017916 |
| expr | min | lq | mean | median | uq | max | |
|---|---|---|---|---|---|---|---|
| 1 | colTabulates_X_S | 1.000000 | 1.000000 | 1.0000000 | 1.000000 | 1.0000000 | 1.0000000 |
| 3 | colTabulates(X[rows, cols]) | 1.016811 | 1.023307 | 0.9869032 | 1.010424 | 0.9690368 | 0.7983148 |
| 2 | colTabulates(X, rows, cols) | 1.016612 | 1.019307 | 0.9934146 | 1.011066 | 0.9666720 | 0.8251816 |
Table: Benchmarking of rowTabulates_X_S(), rowTabulates(X, cols, rows)() and rowTabulates(X[cols, rows])() on 10x1000 data (transposed). The top panel shows times in milliseconds and the bottom panel shows relative times.
| expr | min | lq | mean | median | uq | max | |
|---|---|---|---|---|---|---|---|
| 1 | rowTabulates_X_S | 0.476349 | 0.5000910 | 0.5320341 | 0.5115125 | 0.5340450 | 0.796945 |
| 2 | rowTabulates(X, cols, rows) | 0.485997 | 0.5019740 | 0.5366940 | 0.5225305 | 0.5386760 | 0.946350 |
| 3 | rowTabulates(X[cols, rows]) | 0.487954 | 0.5100865 | 0.5507011 | 0.5254880 | 0.5615825 | 0.845808 |
| expr | min | lq | mean | median | uq | max | |
|---|---|---|---|---|---|---|---|
| 1 | rowTabulates_X_S | 1.000000 | 1.000000 | 1.000000 | 1.000000 | 1.000000 | 1.000000 |
| 2 | rowTabulates(X, cols, rows) | 1.020254 | 1.003765 | 1.008759 | 1.021540 | 1.008672 | 1.187472 |
| 3 | rowTabulates(X[cols, rows]) | 1.024362 | 1.019987 | 1.035086 | 1.027322 | 1.051564 | 1.061313 |
Figure: Benchmarking of colTabulates_X_S(), colTabulates(X, rows, cols)() and colTabulates(X[rows, cols])() on 10x1000 data as well as rowTabulates_X_S(), rowTabulates(X, cols, rows)() and rowTabulates(X[cols, rows])() on the same data transposed. Outliers are displayed as crosses. Times are in milliseconds.
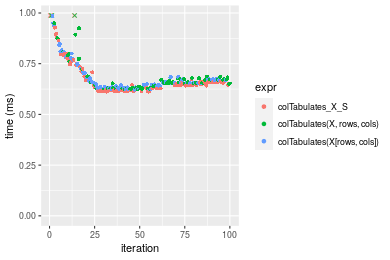
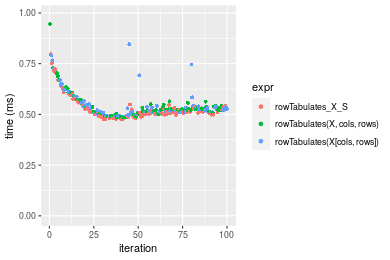 Table: Benchmarking of colTabulates_X_S() and rowTabulates_X_S() on 10x1000 data (original and transposed). The top panel shows times in milliseconds and the bottom panel shows relative times.
| expr | min | lq | mean | median | uq | max | |
|---|---|---|---|---|---|---|---|
| 2 | rowTabulates_X_S | 476.349 | 500.091 | 532.0341 | 511.5125 | 534.0450 | 796.945 |
| 1 | colTabulates_X_S | 611.864 | 620.052 | 687.1486 | 648.3095 | 696.8915 | 1233.566 |
| expr | min | lq | mean | median | uq | max | |
|---|---|---|---|---|---|---|---|
| 2 | rowTabulates_X_S | 1.000000 | 1.000000 | 1.00000 | 1.000000 | 1.00000 | 1.000000 |
| 1 | colTabulates_X_S | 1.284487 | 1.239878 | 1.29155 | 1.267436 | 1.30493 | 1.547868 |
Figure: Benchmarking of colTabulates_X_S() and rowTabulates_X_S() on 10x1000 data (original and transposed). Outliers are displayed as crosses. Times are in milliseconds.
100x1000 matrix
> X <- data[["100x1000"]]
> rows <- sample.int(nrow(X), size = nrow(X) * 0.7)
> cols <- sample.int(ncol(X), size = ncol(X) * 0.7)
> X_S <- X[rows, cols]
> gc()
           used  (Mb) gc trigger  (Mb) max used  (Mb)
Ncells  5298214 283.0    8529671 455.6  8529671 455.6
Vcells 10186470  77.8   31876688 243.2 60562128 462.1
> colStats <- microbenchmark(colTabulates_X_S = colTabulates(X_S, na.rm = FALSE), `colTabulates(X, rows, cols)` = colTabulates(X,
+     rows = rows, cols = cols, na.rm = FALSE), `colTabulates(X[rows, cols])` = colTabulates(X[rows,
+     cols], na.rm = FALSE), unit = "ms")
> X <- t(X)
> X_S <- t(X_S)
> gc()
           used  (Mb) gc trigger  (Mb) max used  (Mb)
Ncells  5298208 283.0    8529671 455.6  8529671 455.6
Vcells 10236553  78.1   31876688 243.2 60562128 462.1
> rowStats <- microbenchmark(rowTabulates_X_S = rowTabulates(X_S, na.rm = FALSE), `rowTabulates(X, cols, rows)` = rowTabulates(X,
+     rows = cols, cols = rows, na.rm = FALSE), `rowTabulates(X[cols, rows])` = rowTabulates(X[cols,
+     rows], na.rm = FALSE), unit = "ms")
Table: Benchmarking of colTabulates_X_S(), colTabulates(X, rows, cols)() and colTabulates(X[rows, cols])() on 100x1000 data. The top panel shows times in milliseconds and the bottom panel shows relative times.
| expr | min | lq | mean | median | uq | max | |
|---|---|---|---|---|---|---|---|
| 1 | colTabulates_X_S | 3.762381 | 3.985139 | 4.100204 | 4.073181 | 4.099504 | 5.993842 |
| 2 | colTabulates(X, rows, cols) | 3.850379 | 4.058884 | 4.182679 | 4.157094 | 4.210005 | 5.607588 |
| 3 | colTabulates(X[rows, cols]) | 3.852800 | 4.074469 | 4.345094 | 4.163357 | 4.247120 | 12.202858 |
| expr | min | lq | mean | median | uq | max | |
|---|---|---|---|---|---|---|---|
| 1 | colTabulates_X_S | 1.000000 | 1.000000 | 1.000000 | 1.000000 | 1.000000 | 1.0000000 |
| 2 | colTabulates(X, rows, cols) | 1.023389 | 1.018505 | 1.020115 | 1.020601 | 1.026955 | 0.9355582 |
| 3 | colTabulates(X[rows, cols]) | 1.024032 | 1.022416 | 1.059726 | 1.022139 | 1.036008 | 2.0358992 |
Table: Benchmarking of rowTabulates_X_S(), rowTabulates(X, cols, rows)() and rowTabulates(X[cols, rows])() on 100x1000 data (transposed). The top panel shows times in milliseconds and the bottom panel shows relative times.
| expr | min | lq | mean | median | uq | max | |
|---|---|---|---|---|---|---|---|
| 1 | rowTabulates_X_S | 3.018624 | 3.341274 | 3.391334 | 3.357582 | 3.420748 | 4.855839 |
| 2 | rowTabulates(X, cols, rows) | 3.107347 | 3.423090 | 3.538556 | 3.433946 | 3.520802 | 10.696302 |
| 3 | rowTabulates(X[cols, rows]) | 3.096200 | 3.419147 | 3.540977 | 3.440817 | 3.538847 | 10.615653 |
| expr | min | lq | mean | median | uq | max | |
|---|---|---|---|---|---|---|---|
| 1 | rowTabulates_X_S | 1.000000 | 1.000000 | 1.000000 | 1.000000 | 1.000000 | 1.000000 |
| 2 | rowTabulates(X, cols, rows) | 1.029392 | 1.024487 | 1.043411 | 1.022744 | 1.029249 | 2.202771 |
| 3 | rowTabulates(X[cols, rows]) | 1.025699 | 1.023306 | 1.044125 | 1.024790 | 1.034524 | 2.186163 |
Figure: Benchmarking of colTabulates_X_S(), colTabulates(X, rows, cols)() and colTabulates(X[rows, cols])() on 100x1000 data as well as rowTabulates_X_S(), rowTabulates(X, cols, rows)() and rowTabulates(X[cols, rows])() on the same data transposed. Outliers are displayed as crosses. Times are in milliseconds.
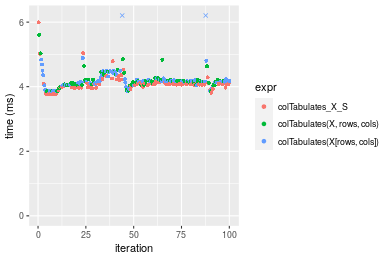
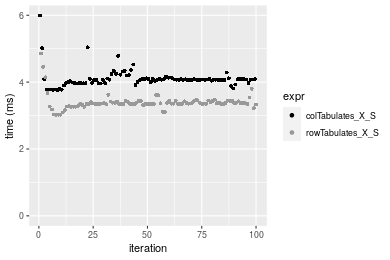
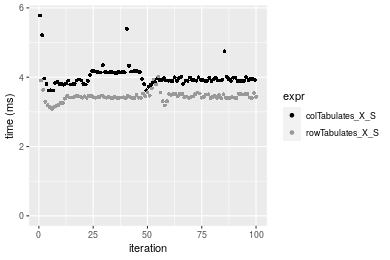
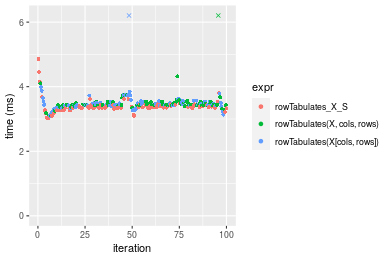 Table: Benchmarking of colTabulates_X_S() and rowTabulates_X_S() on 100x1000 data (original and transposed). The top panel shows times in milliseconds and the bottom panel shows relative times.
| expr | min | lq | mean | median | uq | max | |
|---|---|---|---|---|---|---|---|
| 2 | rowTabulates_X_S | 3.018624 | 3.341274 | 3.391334 | 3.357582 | 3.420748 | 4.855839 |
| 1 | colTabulates_X_S | 3.762381 | 3.985139 | 4.100204 | 4.073181 | 4.099504 | 5.993842 |
| expr | min | lq | mean | median | uq | max | |
|---|---|---|---|---|---|---|---|
| 2 | rowTabulates_X_S | 1.000000 | 1.0000 | 1.000000 | 1.000000 | 1.000000 | 1.000000 |
| 1 | colTabulates_X_S | 1.246389 | 1.1927 | 1.209024 | 1.213129 | 1.198423 | 1.234358 |
Figure: Benchmarking of colTabulates_X_S() and rowTabulates_X_S() on 100x1000 data (original and transposed). Outliers are displayed as crosses. Times are in milliseconds.
1000x100 matrix
> X <- data[["1000x100"]]
> rows <- sample.int(nrow(X), size = nrow(X) * 0.7)
> cols <- sample.int(ncol(X), size = ncol(X) * 0.7)
> X_S <- X[rows, cols]
> gc()
           used  (Mb) gc trigger  (Mb) max used  (Mb)
Ncells  5298445 283.0    8529671 455.6  8529671 455.6
Vcells 10187291  77.8   31876688 243.2 60562128 462.1
> colStats <- microbenchmark(colTabulates_X_S = colTabulates(X_S, na.rm = FALSE), `colTabulates(X, rows, cols)` = colTabulates(X,
+     rows = rows, cols = cols, na.rm = FALSE), `colTabulates(X[rows, cols])` = colTabulates(X[rows,
+     cols], na.rm = FALSE), unit = "ms")
> X <- t(X)
> X_S <- t(X_S)
> gc()
           used  (Mb) gc trigger  (Mb) max used  (Mb)
Ncells  5298421 283.0    8529671 455.6  8529671 455.6
Vcells 10237344  78.2   31876688 243.2 60562128 462.1
> rowStats <- microbenchmark(rowTabulates_X_S = rowTabulates(X_S, na.rm = FALSE), `rowTabulates(X, cols, rows)` = rowTabulates(X,
+     rows = cols, cols = rows, na.rm = FALSE), `rowTabulates(X[cols, rows])` = rowTabulates(X[cols,
+     rows], na.rm = FALSE), unit = "ms")
Table: Benchmarking of colTabulates_X_S(), colTabulates(X, rows, cols)() and colTabulates(X[rows, cols])() on 1000x100 data. The top panel shows times in milliseconds and the bottom panel shows relative times.
| expr | min | lq | mean | median | uq | max | |
|---|---|---|---|---|---|---|---|
| 1 | colTabulates_X_S | 3.614829 | 3.889721 | 4.003826 | 3.921835 | 4.123614 | 5.779987 |
| 2 | colTabulates(X, rows, cols) | 3.676167 | 3.970611 | 4.072485 | 3.994089 | 4.277508 | 4.804207 |
| 3 | colTabulates(X[rows, cols]) | 3.685044 | 3.966757 | 4.142227 | 3.999192 | 4.250722 | 11.539318 |
| expr | min | lq | mean | median | uq | max | |
|---|---|---|---|---|---|---|---|
| 1 | colTabulates_X_S | 1.000000 | 1.000000 | 1.000000 | 1.000000 | 1.000000 | 1.0000000 |
| 2 | colTabulates(X, rows, cols) | 1.016968 | 1.020796 | 1.017149 | 1.018424 | 1.037320 | 0.8311796 |
| 3 | colTabulates(X[rows, cols]) | 1.019424 | 1.019805 | 1.034567 | 1.019725 | 1.030824 | 1.9964263 |
Table: Benchmarking of rowTabulates_X_S(), rowTabulates(X, cols, rows)() and rowTabulates(X[cols, rows])() on 1000x100 data (transposed). The top panel shows times in milliseconds and the bottom panel shows relative times.
| expr | min | lq | mean | median | uq | max | |
|---|---|---|---|---|---|---|---|
| 1 | rowTabulates_X_S | 3.090231 | 3.403376 | 3.443224 | 3.427148 | 3.502330 | 4.016663 |
| 3 | rowTabulates(X[cols, rows]) | 3.144443 | 3.490527 | 3.558763 | 3.525844 | 3.593609 | 4.628401 |
| 2 | rowTabulates(X, cols, rows) | 3.144768 | 3.491172 | 3.742986 | 3.552449 | 3.598092 | 18.289934 |
| expr | min | lq | mean | median | uq | max | |
|---|---|---|---|---|---|---|---|
| 1 | rowTabulates_X_S | 1.000000 | 1.000000 | 1.000000 | 1.000000 | 1.000000 | 1.000000 |
| 3 | rowTabulates(X[cols, rows]) | 1.017543 | 1.025607 | 1.033555 | 1.028798 | 1.026062 | 1.152300 |
| 2 | rowTabulates(X, cols, rows) | 1.017648 | 1.025797 | 1.087059 | 1.036561 | 1.027342 | 4.553515 |
Figure: Benchmarking of colTabulates_X_S(), colTabulates(X, rows, cols)() and colTabulates(X[rows, cols])() on 1000x100 data as well as rowTabulates_X_S(), rowTabulates(X, cols, rows)() and rowTabulates(X[cols, rows])() on the same data transposed. Outliers are displayed as crosses. Times are in milliseconds.
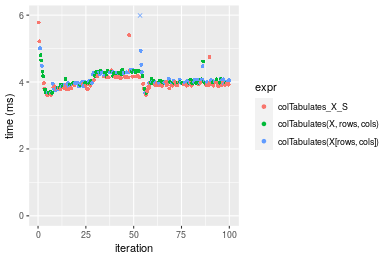
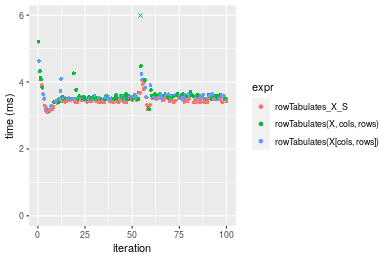 Table: Benchmarking of colTabulates_X_S() and rowTabulates_X_S() on 1000x100 data (original and transposed). The top panel shows times in milliseconds and the bottom panel shows relative times.
| expr | min | lq | mean | median | uq | max | |
|---|---|---|---|---|---|---|---|
| 2 | rowTabulates_X_S | 3.090231 | 3.403376 | 3.443224 | 3.427148 | 3.502330 | 4.016663 |
| 1 | colTabulates_X_S | 3.614829 | 3.889721 | 4.003826 | 3.921835 | 4.123614 | 5.779987 |
| expr | min | lq | mean | median | uq | max | |
|---|---|---|---|---|---|---|---|
| 2 | rowTabulates_X_S | 1.00000 | 1.000000 | 1.000000 | 1.000000 | 1.000000 | 1.000000 |
| 1 | colTabulates_X_S | 1.16976 | 1.142901 | 1.162813 | 1.144343 | 1.177391 | 1.439002 |
Figure: Benchmarking of colTabulates_X_S() and rowTabulates_X_S() on 1000x100 data (original and transposed). Outliers are displayed as crosses. Times are in milliseconds.
Appendix
Session information
R version 4.1.1 Patched (2021-08-10 r80727)
Platform: x86_64-pc-linux-gnu (64-bit)
Running under: Ubuntu 18.04.5 LTS

Matrix products: default
BLAS:   /home/hb/software/R-devel/R-4-1-branch/lib/R/lib/libRblas.so
LAPACK: /home/hb/software/R-devel/R-4-1-branch/lib/R/lib/libRlapack.so

locale:
 [1] LC_CTYPE=en_US.UTF-8       LC_NUMERIC=C
 [3] LC_TIME=en_US.UTF-8        LC_COLLATE=en_US.UTF-8
 [5] LC_MONETARY=en_US.UTF-8    LC_MESSAGES=en_US.UTF-8
 [7] LC_PAPER=en_US.UTF-8       LC_NAME=C
 [9] LC_ADDRESS=C               LC_TELEPHONE=C
[11] LC_MEASUREMENT=en_US.UTF-8 LC_IDENTIFICATION=C

attached base packages:
[1] stats     graphics  grDevices utils     datasets  methods   base

other attached packages:
[1] microbenchmark_1.4-7   matrixStats_0.60.1     ggplot2_3.3.5
[4] knitr_1.33             R.devices_2.17.0       R.utils_2.10.1
[7] R.oo_1.24.0            R.methodsS3_1.8.1-9001 history_0.0.1-9000

loaded via a namespace (and not attached):
 [1] Biobase_2.52.0          httr_1.4.2              splines_4.1.1
 [4] bit64_4.0.5             network_1.17.1          assertthat_0.2.1
 [7] highr_0.9               stats4_4.1.1            blob_1.2.2
[10] GenomeInfoDbData_1.2.6  robustbase_0.93-8       pillar_1.6.2
[13] RSQLite_2.2.8           lattice_0.20-44         glue_1.4.2
[16] digest_0.6.27           XVector_0.32.0          colorspace_2.0-2
[19] Matrix_1.3-4            XML_3.99-0.7            pkgconfig_2.0.3
[22] zlibbioc_1.38.0         genefilter_1.74.0       purrr_0.3.4
[25] ergm_4.1.2              xtable_1.8-4            scales_1.1.1
[28] tibble_3.1.4            annotate_1.70.0         KEGGREST_1.32.0
[31] farver_2.1.0            generics_0.1.0          IRanges_2.26.0
[34] ellipsis_0.3.2          cachem_1.0.6            withr_2.4.2
[37] BiocGenerics_0.38.0     mime_0.11               survival_3.2-13
[40] magrittr_2.0.1          crayon_1.4.1            statnet.common_4.5.0
[43] memoise_2.0.0           laeken_0.5.1            fansi_0.5.0
[46] R.cache_0.15.0          MASS_7.3-54             R.rsp_0.44.0
[49] progressr_0.8.0         tools_4.1.1             lifecycle_1.0.0
[52] S4Vectors_0.30.0        trust_0.1-8             munsell_0.5.0
[55] tabby_0.0.1-9001        AnnotationDbi_1.54.1    Biostrings_2.60.2
[58] compiler_4.1.1          GenomeInfoDb_1.28.1     rlang_0.4.11
[61] grid_4.1.1              RCurl_1.98-1.4          cwhmisc_6.6
[64] rappdirs_0.3.3          startup_0.15.0          labeling_0.4.2
[67] bitops_1.0-7            base64enc_0.1-3         boot_1.3-28
[70] gtable_0.3.0            DBI_1.1.1               markdown_1.1
[73] R6_2.5.1                lpSolveAPI_5.5.2.0-17.7 rle_0.9.2
[76] dplyr_1.0.7             fastmap_1.1.0           bit_4.0.4
[79] utf8_1.2.2              parallel_4.1.1          Rcpp_1.0.7
[82] vctrs_0.3.8             png_0.1-7               DEoptimR_1.0-9
[85] tidyselect_1.1.1        xfun_0.25               coda_0.19-4
Total processing time was 17.19 secs.
Reproducibility
To reproduce this report, do:
html <- matrixStats:::benchmark('colRowTabulates_subset')
Copyright Dongcan Jiang. Last updated on 2021-08-25 19:09:50 (+0200 UTC). Powered by RSP.