matrixStats.benchmarks
colTabulates() and rowTabulates() benchmarks
This report benchmark the performance of colTabulates() and rowTabulates() against alternative methods.
Alternative methods
- ???
Data
> rmatrix <- function(nrow, ncol, mode = c("logical", "double", "integer", "index"), range = c(-100,
+     +100), na_prob = 0) {
+     mode <- match.arg(mode)
+     n <- nrow * ncol
+     if (mode == "logical") {
+         x <- sample(c(FALSE, TRUE), size = n, replace = TRUE)
+     }     else if (mode == "index") {
+         x <- seq_len(n)
+         mode <- "integer"
+     }     else {
+         x <- runif(n, min = range[1], max = range[2])
+     }
+     storage.mode(x) <- mode
+     if (na_prob > 0)
+         x[sample(n, size = na_prob * n)] <- NA
+     dim(x) <- c(nrow, ncol)
+     x
+ }
> rmatrices <- function(scale = 10, seed = 1, ...) {
+     set.seed(seed)
+     data <- list()
+     data[[1]] <- rmatrix(nrow = scale * 1, ncol = scale * 1, ...)
+     data[[2]] <- rmatrix(nrow = scale * 10, ncol = scale * 10, ...)
+     data[[3]] <- rmatrix(nrow = scale * 100, ncol = scale * 1, ...)
+     data[[4]] <- t(data[[3]])
+     data[[5]] <- rmatrix(nrow = scale * 10, ncol = scale * 100, ...)
+     data[[6]] <- t(data[[5]])
+     names(data) <- sapply(data, FUN = function(x) paste(dim(x), collapse = "x"))
+     data
+ }
> data <- rmatrices(mode = "integer", range = c(-10, 10))
Results
10x10 matrix
> X <- data[["10x10"]]
> gc()
           used  (Mb) gc trigger  (Mb) max used  (Mb)
Ncells  5311494 283.7    8529671 455.6  8529671 455.6
Vcells 10408753  79.5   31876688 243.2 60562128 462.1
> colStats <- microbenchmark(colTabulates = colTabulates(X, na.rm = FALSE), unit = "ms")
> X <- t(X)
> gc()
           used  (Mb) gc trigger  (Mb) max used  (Mb)
Ncells  5300863 283.1    8529671 455.6  8529671 455.6
Vcells 10373608  79.2   31876688 243.2 60562128 462.1
> rowStats <- microbenchmark(rowTabulates = rowTabulates(X, na.rm = FALSE), unit = "ms")
Table: Benchmarking of colTabulates() on 10x10 data. The top panel shows times in milliseconds and the bottom panel shows relative times.
| expr | min | lq | mean | median | uq | max | |
|---|---|---|---|---|---|---|---|
| 1 | colTabulates | 0.200796 | 0.208996 | 0.2335093 | 0.2277525 | 0.2421055 | 0.418391 |
| expr | min | lq | mean | median | uq | max | |
|---|---|---|---|---|---|---|---|
| 1 | colTabulates | 1 | 1 | 1 | 1 | 1 | 1 |
Table: Benchmarking of rowTabulates() on 10x10 data (transposed). The top panel shows times in milliseconds and the bottom panel shows relative times.
| expr | min | lq | mean | median | uq | max | |
|---|---|---|---|---|---|---|---|
| 1 | rowTabulates | 0.184417 | 0.1888755 | 0.2109911 | 0.201807 | 0.222414 | 0.396027 |
| expr | min | lq | mean | median | uq | max | |
|---|---|---|---|---|---|---|---|
| 1 | rowTabulates | 1 | 1 | 1 | 1 | 1 | 1 |
Figure: Benchmarking of colTabulates() on 10x10 data as well as rowTabulates() on the same data transposed. Outliers are displayed as crosses. Times are in milliseconds.
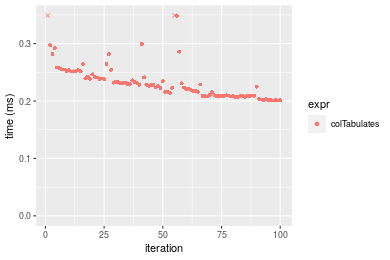
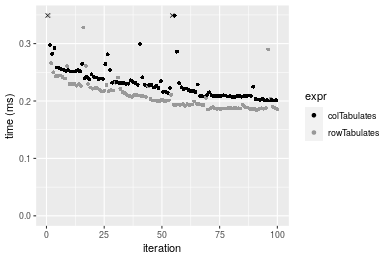
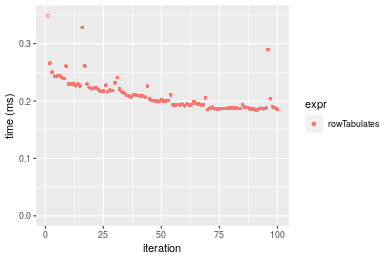 Table: Benchmarking of colTabulates() and rowTabulates() on 10x10 data (original and transposed). The top panel shows times in milliseconds and the bottom panel shows relative times.
| expr | min | lq | mean | median | uq | max | |
|---|---|---|---|---|---|---|---|
| 2 | rowTabulates | 184.417 | 188.8755 | 210.9911 | 201.8070 | 222.4140 | 396.027 |
| 1 | colTabulates | 200.796 | 208.9960 | 233.5093 | 227.7525 | 242.1055 | 418.391 |
| expr | min | lq | mean | median | uq | max | |
|---|---|---|---|---|---|---|---|
| 2 | rowTabulates | 1.000000 | 1.000000 | 1.000000 | 1.000000 | 1.000000 | 1.000000 |
| 1 | colTabulates | 1.088815 | 1.106528 | 1.106726 | 1.128566 | 1.088535 | 1.056471 |
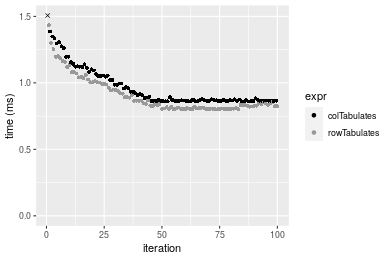
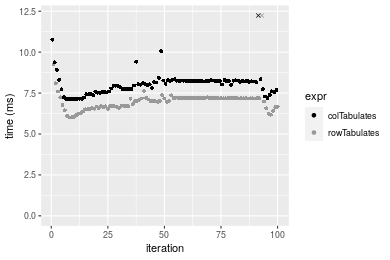
Figure: Benchmarking of colTabulates() and rowTabulates() on 10x10 data (original and transposed). Outliers are displayed as crosses. Times are in milliseconds.
100x100 matrix
> X <- data[["100x100"]]
> gc()
           used  (Mb) gc trigger  (Mb) max used  (Mb)
Ncells  5299388 283.1    8529671 455.6  8529671 455.6
Vcells 10179191  77.7   31876688 243.2 60562128 462.1
> colStats <- microbenchmark(colTabulates = colTabulates(X, na.rm = FALSE), unit = "ms")
> X <- t(X)
> gc()
           used  (Mb) gc trigger  (Mb) max used  (Mb)
Ncells  5299364 283.1    8529671 455.6  8529671 455.6
Vcells 10184204  77.7   31876688 243.2 60562128 462.1
> rowStats <- microbenchmark(rowTabulates = rowTabulates(X, na.rm = FALSE), unit = "ms")
Table: Benchmarking of colTabulates() on 100x100 data. The top panel shows times in milliseconds and the bottom panel shows relative times.
| expr | min | lq | mean | median | uq | max | |
|---|---|---|---|---|---|---|---|
| 1 | colTabulates | 0.89613 | 0.90192 | 1.002669 | 0.9148855 | 1.076334 | 1.623157 |
| expr | min | lq | mean | median | uq | max | |
|---|---|---|---|---|---|---|---|
| 1 | colTabulates | 1 | 1 | 1 | 1 | 1 | 1 |
Table: Benchmarking of rowTabulates() on 100x100 data (transposed). The top panel shows times in milliseconds and the bottom panel shows relative times.
| expr | min | lq | mean | median | uq | max | |
|---|---|---|---|---|---|---|---|
| 1 | rowTabulates | 0.746042 | 0.753732 | 0.845929 | 0.7876005 | 0.9122535 | 1.307988 |
| expr | min | lq | mean | median | uq | max | |
|---|---|---|---|---|---|---|---|
| 1 | rowTabulates | 1 | 1 | 1 | 1 | 1 | 1 |
Figure: Benchmarking of colTabulates() on 100x100 data as well as rowTabulates() on the same data transposed. Outliers are displayed as crosses. Times are in milliseconds.
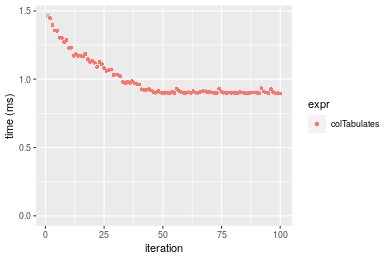
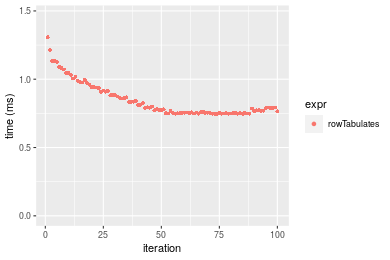 Table: Benchmarking of colTabulates() and rowTabulates() on 100x100 data (original and transposed). The top panel shows times in milliseconds and the bottom panel shows relative times.
| expr | min | lq | mean | median | uq | max | |
|---|---|---|---|---|---|---|---|
| 2 | rowTabulates | 746.042 | 753.732 | 845.929 | 787.6005 | 912.2535 | 1307.988 |
| 1 | colTabulates | 896.130 | 901.920 | 1002.669 | 914.8855 | 1076.3340 | 1623.157 |
| expr | min | lq | mean | median | uq | max | |
|---|---|---|---|---|---|---|---|
| 2 | rowTabulates | 1.000000 | 1.000000 | 1.000000 | 1.000000 | 1.000000 | 1.000000 |
| 1 | colTabulates | 1.201179 | 1.196606 | 1.185287 | 1.161611 | 1.179863 | 1.240957 |
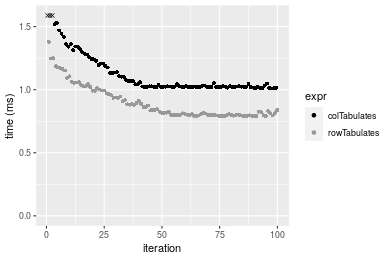
Figure: Benchmarking of colTabulates() and rowTabulates() on 100x100 data (original and transposed). Outliers are displayed as crosses. Times are in milliseconds.
1000x10 matrix
> X <- data[["1000x10"]]
> gc()
           used  (Mb) gc trigger  (Mb) max used  (Mb)
Ncells  5300098 283.1    8529671 455.6  8529671 455.6
Vcells 10182476  77.7   31876688 243.2 60562128 462.1
> colStats <- microbenchmark(colTabulates = colTabulates(X, na.rm = FALSE), unit = "ms")
> X <- t(X)
> gc()
           used  (Mb) gc trigger  (Mb) max used  (Mb)
Ncells  5300074 283.1    8529671 455.6  8529671 455.6
Vcells 10187489  77.8   31876688 243.2 60562128 462.1
> rowStats <- microbenchmark(rowTabulates = rowTabulates(X, na.rm = FALSE), unit = "ms")
Table: Benchmarking of colTabulates() on 1000x10 data. The top panel shows times in milliseconds and the bottom panel shows relative times.
| expr | min | lq | mean | median | uq | max | |
|---|---|---|---|---|---|---|---|
| 1 | colTabulates | 0.860093 | 0.864503 | 0.9657351 | 0.8754475 | 1.051473 | 1.571701 |
| expr | min | lq | mean | median | uq | max | |
|---|---|---|---|---|---|---|---|
| 1 | colTabulates | 1 | 1 | 1 | 1 | 1 | 1 |
Table: Benchmarking of rowTabulates() on 1000x10 data (transposed). The top panel shows times in milliseconds and the bottom panel shows relative times.
| expr | min | lq | mean | median | uq | max | |
|---|---|---|---|---|---|---|---|
| 1 | rowTabulates | 0.800912 | 0.808628 | 0.9056396 | 0.841111 | 0.9895585 | 1.43481 |
| expr | min | lq | mean | median | uq | max | |
|---|---|---|---|---|---|---|---|
| 1 | rowTabulates | 1 | 1 | 1 | 1 | 1 | 1 |
Figure: Benchmarking of colTabulates() on 1000x10 data as well as rowTabulates() on the same data transposed. Outliers are displayed as crosses. Times are in milliseconds.
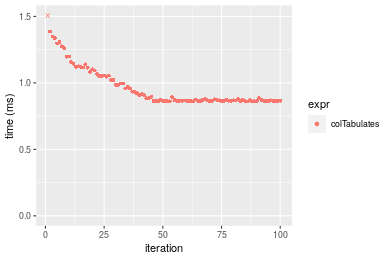
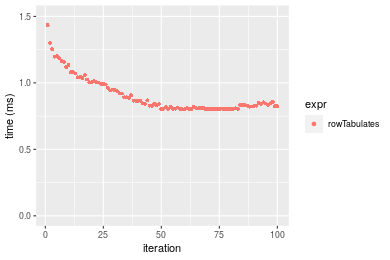 Table: Benchmarking of colTabulates() and rowTabulates() on 1000x10 data (original and transposed). The top panel shows times in milliseconds and the bottom panel shows relative times.
| expr | min | lq | mean | median | uq | max | |
|---|---|---|---|---|---|---|---|
| 2 | rowTabulates | 800.912 | 808.628 | 905.6396 | 841.1110 | 989.5585 | 1434.810 |
| 1 | colTabulates | 860.093 | 864.503 | 965.7351 | 875.4475 | 1051.4735 | 1571.701 |
| expr | min | lq | mean | median | uq | max | |
|---|---|---|---|---|---|---|---|
| 2 | rowTabulates | 1.000000 | 1.000000 | 1.000000 | 1.000000 | 1.000000 | 1.000000 |
| 1 | colTabulates | 1.073892 | 1.069098 | 1.066357 | 1.040823 | 1.062568 | 1.095407 |
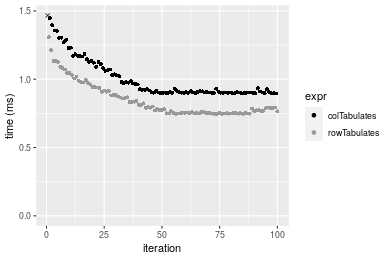
Figure: Benchmarking of colTabulates() and rowTabulates() on 1000x10 data (original and transposed). Outliers are displayed as crosses. Times are in milliseconds.
10x1000 matrix
> X <- data[["10x1000"]]
> gc()
           used  (Mb) gc trigger  (Mb) max used  (Mb)
Ncells  5300269 283.1    8529671 455.6  8529671 455.6
Vcells 10183056  77.7   31876688 243.2 60562128 462.1
> colStats <- microbenchmark(colTabulates = colTabulates(X, na.rm = FALSE), unit = "ms")
> X <- t(X)
> gc()
           used  (Mb) gc trigger  (Mb) max used  (Mb)
Ncells  5300245 283.1    8529671 455.6  8529671 455.6
Vcells 10188069  77.8   31876688 243.2 60562128 462.1
> rowStats <- microbenchmark(rowTabulates = rowTabulates(X, na.rm = FALSE), unit = "ms")
Table: Benchmarking of colTabulates() on 10x1000 data. The top panel shows times in milliseconds and the bottom panel shows relative times.
| expr | min | lq | mean | median | uq | max | |
|---|---|---|---|---|---|---|---|
| 1 | colTabulates | 1.009477 | 1.021954 | 1.123117 | 1.027907 | 1.192078 | 1.803143 |
| expr | min | lq | mean | median | uq | max | |
|---|---|---|---|---|---|---|---|
| 1 | colTabulates | 1 | 1 | 1 | 1 | 1 | 1 |
Table: Benchmarking of rowTabulates() on 10x1000 data (transposed). The top panel shows times in milliseconds and the bottom panel shows relative times.
| expr | min | lq | mean | median | uq | max | |
|---|---|---|---|---|---|---|---|
| 1 | rowTabulates | 0.790652 | 0.798742 | 0.8974349 | 0.8273515 | 0.9820365 | 1.380423 |
| expr | min | lq | mean | median | uq | max | |
|---|---|---|---|---|---|---|---|
| 1 | rowTabulates | 1 | 1 | 1 | 1 | 1 | 1 |
Figure: Benchmarking of colTabulates() on 10x1000 data as well as rowTabulates() on the same data transposed. Outliers are displayed as crosses. Times are in milliseconds.
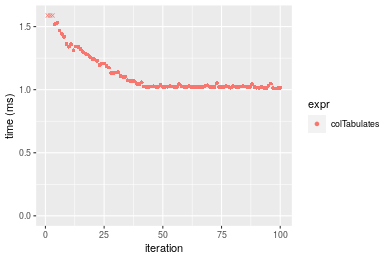
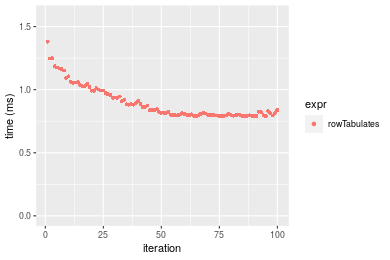 Table: Benchmarking of colTabulates() and rowTabulates() on 10x1000 data (original and transposed). The top panel shows times in milliseconds and the bottom panel shows relative times.
| expr | min | lq | mean | median | uq | max | |
|---|---|---|---|---|---|---|---|
| 2 | rowTabulates | 790.652 | 798.742 | 897.4349 | 827.3515 | 982.0365 | 1380.423 |
| 1 | colTabulates | 1009.477 | 1021.954 | 1123.1173 | 1027.9065 | 1192.0780 | 1803.143 |
| expr | min | lq | mean | median | uq | max | |
|---|---|---|---|---|---|---|---|
| 2 | rowTabulates | 1.000000 | 1.000000 | 1.000000 | 1.000000 | 1.000000 | 1.000000 |
| 1 | colTabulates | 1.276765 | 1.279454 | 1.251475 | 1.242406 | 1.213884 | 1.306225 |
Figure: Benchmarking of colTabulates() and rowTabulates() on 10x1000 data (original and transposed). Outliers are displayed as crosses. Times are in milliseconds.
100x1000 matrix
> X <- data[["100x1000"]]
> gc()
           used  (Mb) gc trigger  (Mb) max used  (Mb)
Ncells  5300440 283.1    8529671 455.6  8529671 455.6
Vcells 10183470  77.7   31876688 243.2 60562128 462.1
> colStats <- microbenchmark(colTabulates = colTabulates(X, na.rm = FALSE), unit = "ms")
> X <- t(X)
> gc()
           used  (Mb) gc trigger  (Mb) max used  (Mb)
Ncells  5300416 283.1    8529671 455.6  8529671 455.6
Vcells 10233483  78.1   31876688 243.2 60562128 462.1
> rowStats <- microbenchmark(rowTabulates = rowTabulates(X, na.rm = FALSE), unit = "ms")
Table: Benchmarking of colTabulates() on 100x1000 data. The top panel shows times in milliseconds and the bottom panel shows relative times.
| expr | min | lq | mean | median | uq | max | |
|---|---|---|---|---|---|---|---|
| 1 | colTabulates | 7.381303 | 7.871758 | 8.220046 | 8.076244 | 8.449096 | 16.25676 |
| expr | min | lq | mean | median | uq | max | |
|---|---|---|---|---|---|---|---|
| 1 | colTabulates | 1 | 1 | 1 | 1 | 1 | 1 |
Table: Benchmarking of rowTabulates() on 100x1000 data (transposed). The top panel shows times in milliseconds and the bottom panel shows relative times.
| expr | min | lq | mean | median | uq | max | |
|---|---|---|---|---|---|---|---|
| 1 | rowTabulates | 5.950909 | 6.615869 | 6.916672 | 6.858141 | 7.110574 | 13.93921 |
| expr | min | lq | mean | median | uq | max | |
|---|---|---|---|---|---|---|---|
| 1 | rowTabulates | 1 | 1 | 1 | 1 | 1 | 1 |
Figure: Benchmarking of colTabulates() on 100x1000 data as well as rowTabulates() on the same data transposed. Outliers are displayed as crosses. Times are in milliseconds.
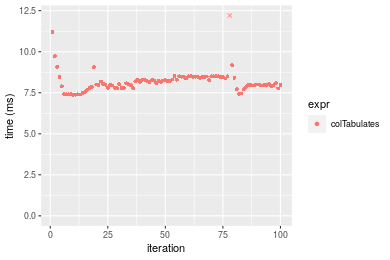
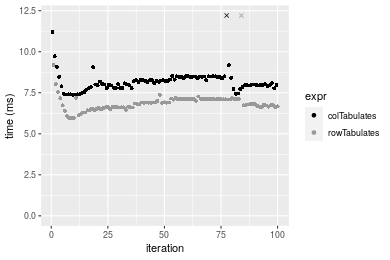
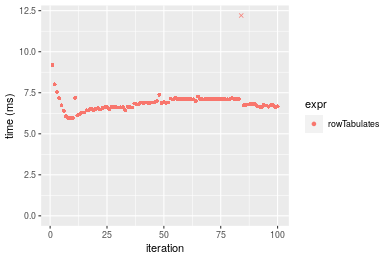 Table: Benchmarking of colTabulates() and rowTabulates() on 100x1000 data (original and transposed). The top panel shows times in milliseconds and the bottom panel shows relative times.
| expr | min | lq | mean | median | uq | max | |
|---|---|---|---|---|---|---|---|
| 2 | rowTabulates | 5.950909 | 6.615869 | 6.916672 | 6.858141 | 7.110574 | 13.93921 |
| 1 | colTabulates | 7.381303 | 7.871758 | 8.220046 | 8.076244 | 8.449096 | 16.25676 |
| expr | min | lq | mean | median | uq | max | |
|---|---|---|---|---|---|---|---|
| 2 | rowTabulates | 1.000000 | 1.00000 | 1.00000 | 1.000000 | 1.000000 | 1.000000 |
| 1 | colTabulates | 1.240366 | 1.18983 | 1.18844 | 1.177614 | 1.188244 | 1.166261 |
Figure: Benchmarking of colTabulates() and rowTabulates() on 100x1000 data (original and transposed). Outliers are displayed as crosses. Times are in milliseconds.
1000x100 matrix
> X <- data[["1000x100"]]
> gc()
           used  (Mb) gc trigger  (Mb) max used  (Mb)
Ncells  5300611 283.1    8529671 455.6  8529671 455.6
Vcells 10183946  77.7   31876688 243.2 60562128 462.1
> colStats <- microbenchmark(colTabulates = colTabulates(X, na.rm = FALSE), unit = "ms")
> X <- t(X)
> gc()
           used  (Mb) gc trigger  (Mb) max used  (Mb)
Ncells  5300587 283.1    8529671 455.6  8529671 455.6
Vcells 10233959  78.1   31876688 243.2 60562128 462.1
> rowStats <- microbenchmark(rowTabulates = rowTabulates(X, na.rm = FALSE), unit = "ms")
Table: Benchmarking of colTabulates() on 1000x100 data. The top panel shows times in milliseconds and the bottom panel shows relative times.
| expr | min | lq | mean | median | uq | max | |
|---|---|---|---|---|---|---|---|
| 1 | colTabulates | 7.126875 | 7.600936 | 8.079965 | 8.128756 | 8.25222 | 15.87042 |
| expr | min | lq | mean | median | uq | max | |
|---|---|---|---|---|---|---|---|
| 1 | colTabulates | 1 | 1 | 1 | 1 | 1 | 1 |
Table: Benchmarking of rowTabulates() on 1000x100 data (transposed). The top panel shows times in milliseconds and the bottom panel shows relative times.
| expr | min | lq | mean | median | uq | max | |
|---|---|---|---|---|---|---|---|
| 1 | rowTabulates | 6.009416 | 6.675867 | 7.025864 | 7.16213 | 7.192888 | 14.00688 |
| expr | min | lq | mean | median | uq | max | |
|---|---|---|---|---|---|---|---|
| 1 | rowTabulates | 1 | 1 | 1 | 1 | 1 | 1 |
Figure: Benchmarking of colTabulates() on 1000x100 data as well as rowTabulates() on the same data transposed. Outliers are displayed as crosses. Times are in milliseconds.
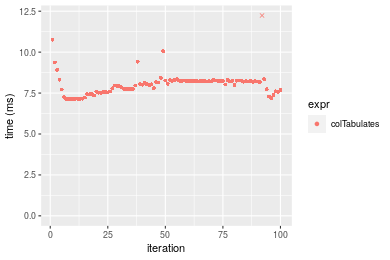
 Table: Benchmarking of colTabulates() and rowTabulates() on 1000x100 data (original and transposed). The top panel shows times in milliseconds and the bottom panel shows relative times.
| expr | min | lq | mean | median | uq | max | |
|---|---|---|---|---|---|---|---|
| 2 | rowTabulates | 6.009416 | 6.675867 | 7.025864 | 7.162130 | 7.192888 | 14.00688 |
| 1 | colTabulates | 7.126875 | 7.600936 | 8.079965 | 8.128756 | 8.252220 | 15.87042 |
| expr | min | lq | mean | median | uq | max | |
|---|---|---|---|---|---|---|---|
| 2 | rowTabulates | 1.000000 | 1.000000 | 1.000000 | 1.000000 | 1.000000 | 1.000000 |
| 1 | colTabulates | 1.185951 | 1.138569 | 1.150032 | 1.134964 | 1.147275 | 1.133045 |
Figure: Benchmarking of colTabulates() and rowTabulates() on 1000x100 data (original and transposed). Outliers are displayed as crosses. Times are in milliseconds.
Appendix
Session information
R version 4.1.1 Patched (2021-08-10 r80727)
Platform: x86_64-pc-linux-gnu (64-bit)
Running under: Ubuntu 18.04.5 LTS

Matrix products: default
BLAS:   /home/hb/software/R-devel/R-4-1-branch/lib/R/lib/libRblas.so
LAPACK: /home/hb/software/R-devel/R-4-1-branch/lib/R/lib/libRlapack.so

locale:
 [1] LC_CTYPE=en_US.UTF-8       LC_NUMERIC=C
 [3] LC_TIME=en_US.UTF-8        LC_COLLATE=en_US.UTF-8
 [5] LC_MONETARY=en_US.UTF-8    LC_MESSAGES=en_US.UTF-8
 [7] LC_PAPER=en_US.UTF-8       LC_NAME=C
 [9] LC_ADDRESS=C               LC_TELEPHONE=C
[11] LC_MEASUREMENT=en_US.UTF-8 LC_IDENTIFICATION=C

attached base packages:
[1] stats     graphics  grDevices utils     datasets  methods   base

other attached packages:
[1] microbenchmark_1.4-7   matrixStats_0.60.1     ggplot2_3.3.5
[4] knitr_1.33             R.devices_2.17.0       R.utils_2.10.1
[7] R.oo_1.24.0            R.methodsS3_1.8.1-9001 history_0.0.1-9000

loaded via a namespace (and not attached):
 [1] Biobase_2.52.0          httr_1.4.2              splines_4.1.1
 [4] bit64_4.0.5             network_1.17.1          assertthat_0.2.1
 [7] highr_0.9               stats4_4.1.1            blob_1.2.2
[10] GenomeInfoDbData_1.2.6  robustbase_0.93-8       pillar_1.6.2
[13] RSQLite_2.2.8           lattice_0.20-44         glue_1.4.2
[16] digest_0.6.27           XVector_0.32.0          colorspace_2.0-2
[19] Matrix_1.3-4            XML_3.99-0.7            pkgconfig_2.0.3
[22] zlibbioc_1.38.0         genefilter_1.74.0       purrr_0.3.4
[25] ergm_4.1.2              xtable_1.8-4            scales_1.1.1
[28] tibble_3.1.4            annotate_1.70.0         KEGGREST_1.32.0
[31] farver_2.1.0            generics_0.1.0          IRanges_2.26.0
[34] ellipsis_0.3.2          cachem_1.0.6            withr_2.4.2
[37] BiocGenerics_0.38.0     mime_0.11               survival_3.2-13
[40] magrittr_2.0.1          crayon_1.4.1            statnet.common_4.5.0
[43] memoise_2.0.0           laeken_0.5.1            fansi_0.5.0
[46] R.cache_0.15.0          MASS_7.3-54             R.rsp_0.44.0
[49] progressr_0.8.0         tools_4.1.1             lifecycle_1.0.0
[52] S4Vectors_0.30.0        trust_0.1-8             munsell_0.5.0
[55] tabby_0.0.1-9001        AnnotationDbi_1.54.1    Biostrings_2.60.2
[58] compiler_4.1.1          GenomeInfoDb_1.28.1     rlang_0.4.11
[61] grid_4.1.1              RCurl_1.98-1.4          cwhmisc_6.6
[64] rappdirs_0.3.3          startup_0.15.0          labeling_0.4.2
[67] bitops_1.0-7            base64enc_0.1-3         boot_1.3-28
[70] gtable_0.3.0            DBI_1.1.1               markdown_1.1
[73] R6_2.5.1                lpSolveAPI_5.5.2.0-17.7 rle_0.9.2
[76] dplyr_1.0.7             fastmap_1.1.0           bit_4.0.4
[79] utf8_1.2.2              parallel_4.1.1          Rcpp_1.0.7
[82] vctrs_0.3.8             png_0.1-7               DEoptimR_1.0-9
[85] tidyselect_1.1.1        xfun_0.25               coda_0.19-4
Total processing time was 14.79 secs.
Reproducibility
To reproduce this report, do:
html <- matrixStats:::benchmark('colTabulates')
Copyright Henrik Bengtsson. Last updated on 2021-08-25 19:10:06 (+0200 UTC). Powered by RSP.