matrixStats.benchmarks
colAlls() and rowAlls() benchmarks on subsetted computation
This report benchmark the performance of colAlls() and rowAlls() on subsetted computation.
Data
> rmatrix <- function(nrow, ncol, mode = c("logical", "double", "integer", "index"), range = c(-100,
+     +100), na_prob = 0) {
+     mode <- match.arg(mode)
+     n <- nrow * ncol
+     if (mode == "logical") {
+         x <- sample(c(FALSE, TRUE), size = n, replace = TRUE)
+     }     else if (mode == "index") {
+         x <- seq_len(n)
+         mode <- "integer"
+     }     else {
+         x <- runif(n, min = range[1], max = range[2])
+     }
+     storage.mode(x) <- mode
+     if (na_prob > 0)
+         x[sample(n, size = na_prob * n)] <- NA
+     dim(x) <- c(nrow, ncol)
+     x
+ }
> rmatrices <- function(scale = 10, seed = 1, ...) {
+     set.seed(seed)
+     data <- list()
+     data[[1]] <- rmatrix(nrow = scale * 1, ncol = scale * 1, ...)
+     data[[2]] <- rmatrix(nrow = scale * 10, ncol = scale * 10, ...)
+     data[[3]] <- rmatrix(nrow = scale * 100, ncol = scale * 1, ...)
+     data[[4]] <- t(data[[3]])
+     data[[5]] <- rmatrix(nrow = scale * 10, ncol = scale * 100, ...)
+     data[[6]] <- t(data[[5]])
+     names(data) <- sapply(data, FUN = function(x) paste(dim(x), collapse = "x"))
+     data
+ }
> data <- rmatrices(mode = "logical")
Results
10x10 matrix
> X <- data[["10x10"]]
> rows <- sample.int(nrow(X), size = nrow(X) * 0.7)
> cols <- sample.int(ncol(X), size = ncol(X) * 0.7)
> X_S <- X[rows, cols]
> gc()
          used  (Mb) gc trigger  (Mb) max used  (Mb)
Ncells 5160636 275.7    8529671 455.6  8529671 455.6
Vcells 9219569  70.4   31876688 243.2 60562128 462.1
> colStats <- microbenchmark(colAlls_X_S = colAlls(X_S), `colAlls(X, rows, cols)` = colAlls(X, rows = rows,
+     cols = cols), `colAlls(X[rows, cols])` = colAlls(X[rows, cols]), unit = "ms")
> X <- t(X)
> X_S <- t(X_S)
> gc()
          used  (Mb) gc trigger  (Mb) max used  (Mb)
Ncells 5152999 275.2    8529671 455.6  8529671 455.6
Vcells 9194177  70.2   31876688 243.2 60562128 462.1
> rowStats <- microbenchmark(rowAlls_X_S = rowAlls(X_S), `rowAlls(X, cols, rows)` = rowAlls(X, rows = cols,
+     cols = rows), `rowAlls(X[cols, rows])` = rowAlls(X[cols, rows]), unit = "ms")
Table: Benchmarking of colAlls_X_S(), colAlls(X, rows, cols)() and colAlls(X[rows, cols])() on 10x10 data. The top panel shows times in milliseconds and the bottom panel shows relative times.
| expr | min | lq | mean | median | uq | max | |
|---|---|---|---|---|---|---|---|
| 1 | colAlls_X_S | 0.002986 | 0.0030440 | 0.0059195 | 0.0031130 | 0.0032130 | 0.278269 |
| 2 | colAlls(X, rows, cols) | 0.003362 | 0.0034715 | 0.0036577 | 0.0035425 | 0.0036075 | 0.010617 |
| 3 | colAlls(X[rows, cols]) | 0.003821 | 0.0040975 | 0.0042836 | 0.0042015 | 0.0043075 | 0.008599 |
| expr | min | lq | mean | median | uq | max | |
|---|---|---|---|---|---|---|---|
| 1 | colAlls_X_S | 1.000000 | 1.000000 | 1.0000000 | 1.000000 | 1.000000 | 1.0000000 |
| 2 | colAlls(X, rows, cols) | 1.125921 | 1.140440 | 0.6179130 | 1.137970 | 1.122782 | 0.0381537 |
| 3 | colAlls(X[rows, cols]) | 1.279638 | 1.346091 | 0.7236434 | 1.349663 | 1.340647 | 0.0309018 |
Table: Benchmarking of rowAlls_X_S(), rowAlls(X, cols, rows)() and rowAlls(X[cols, rows])() on 10x10 data (transposed). The top panel shows times in milliseconds and the bottom panel shows relative times.
| expr | min | lq | mean | median | uq | max | |
|---|---|---|---|---|---|---|---|
| 1 | rowAlls_X_S | 0.002893 | 0.0029690 | 0.0031030 | 0.0030435 | 0.003138 | 0.005617 |
| 2 | rowAlls(X, cols, rows) | 0.003292 | 0.0034080 | 0.0063518 | 0.0034860 | 0.003609 | 0.284589 |
| 3 | rowAlls(X[cols, rows]) | 0.003771 | 0.0040265 | 0.0042005 | 0.0041450 | 0.004269 | 0.006579 |
| expr | min | lq | mean | median | uq | max | |
|---|---|---|---|---|---|---|---|
| 1 | rowAlls_X_S | 1.000000 | 1.000000 | 1.000000 | 1.000000 | 1.000000 | 1.000000 |
| 2 | rowAlls(X, cols, rows) | 1.137919 | 1.147861 | 2.046961 | 1.145392 | 1.150096 | 50.665658 |
| 3 | rowAlls(X[cols, rows]) | 1.303491 | 1.356181 | 1.353672 | 1.361919 | 1.360421 | 1.171266 |
Figure: Benchmarking of colAlls_X_S(), colAlls(X, rows, cols)() and colAlls(X[rows, cols])() on 10x10 data as well as rowAlls_X_S(), rowAlls(X, cols, rows)() and rowAlls(X[cols, rows])() on the same data transposed. Outliers are displayed as crosses. Times are in milliseconds.
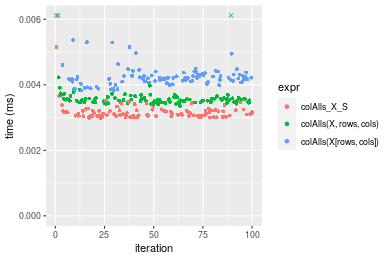
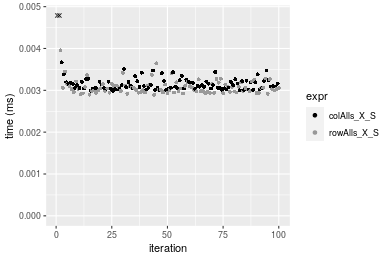
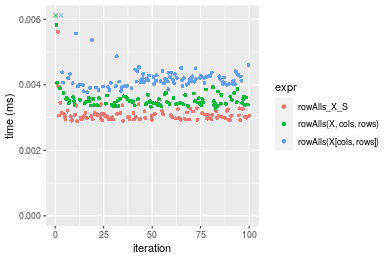 Table: Benchmarking of colAlls_X_S() and rowAlls_X_S() on 10x10 data (original and transposed). The top panel shows times in milliseconds and the bottom panel shows relative times.
| expr | min | lq | mean | median | uq | max | |
|---|---|---|---|---|---|---|---|
| 2 | rowAlls_X_S | 2.893 | 2.969 | 3.10302 | 3.0435 | 3.138 | 5.617 |
| 1 | colAlls_X_S | 2.986 | 3.044 | 5.91949 | 3.1130 | 3.213 | 278.269 |
| expr | min | lq | mean | median | uq | max | |
|---|---|---|---|---|---|---|---|
| 2 | rowAlls_X_S | 1.000000 | 1.000000 | 1.000000 | 1.000000 | 1.000000 | 1.0000 |
| 1 | colAlls_X_S | 1.032147 | 1.025261 | 1.907655 | 1.022836 | 1.023901 | 49.5405 |
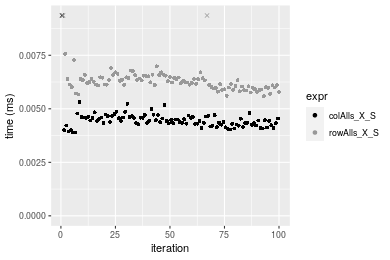
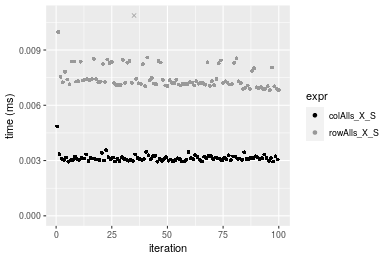
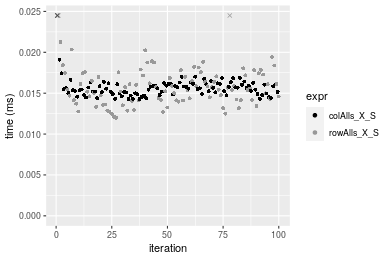
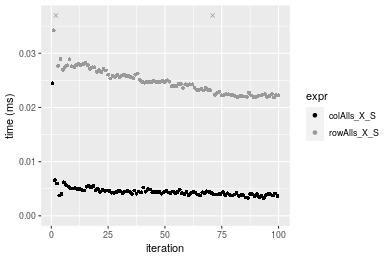
Figure: Benchmarking of colAlls_X_S() and rowAlls_X_S() on 10x10 data (original and transposed). Outliers are displayed as crosses. Times are in milliseconds.
100x100 matrix
> X <- data[["100x100"]]
> rows <- sample.int(nrow(X), size = nrow(X) * 0.7)
> cols <- sample.int(ncol(X), size = ncol(X) * 0.7)
> X_S <- X[rows, cols]
> gc()
          used  (Mb) gc trigger  (Mb) max used  (Mb)
Ncells 5152729 275.2    8529671 455.6  8529671 455.6
Vcells 9159001  69.9   31876688 243.2 60562128 462.1
> colStats <- microbenchmark(colAlls_X_S = colAlls(X_S), `colAlls(X, rows, cols)` = colAlls(X, rows = rows,
+     cols = cols), `colAlls(X[rows, cols])` = colAlls(X[rows, cols]), unit = "ms")
> X <- t(X)
> X_S <- t(X_S)
> gc()
          used  (Mb) gc trigger  (Mb) max used  (Mb)
Ncells 5152705 275.2    8529671 455.6  8529671 455.6
Vcells 9164054  70.0   31876688 243.2 60562128 462.1
> rowStats <- microbenchmark(rowAlls_X_S = rowAlls(X_S), `rowAlls(X, cols, rows)` = rowAlls(X, rows = cols,
+     cols = rows), `rowAlls(X[cols, rows])` = rowAlls(X[cols, rows]), unit = "ms")
Table: Benchmarking of colAlls_X_S(), colAlls(X, rows, cols)() and colAlls(X[rows, cols])() on 100x100 data. The top panel shows times in milliseconds and the bottom panel shows relative times.
| expr | min | lq | mean | median | uq | max | |
|---|---|---|---|---|---|---|---|
| 1 | colAlls_X_S | 0.003892 | 0.0042700 | 0.0045061 | 0.0044345 | 0.0046165 | 0.010616 |
| 2 | colAlls(X, rows, cols) | 0.005127 | 0.0055205 | 0.0058478 | 0.0057885 | 0.0059955 | 0.010613 |
| 3 | colAlls(X[rows, cols]) | 0.020120 | 0.0204070 | 0.0211569 | 0.0206730 | 0.0209035 | 0.050245 |
| expr | min | lq | mean | median | uq | max | |
|---|---|---|---|---|---|---|---|
| 1 | colAlls_X_S | 1.000000 | 1.000000 | 1.000000 | 1.000000 | 1.000000 | 1.0000000 |
| 2 | colAlls(X, rows, cols) | 1.317318 | 1.292857 | 1.297747 | 1.305333 | 1.298711 | 0.9997174 |
| 3 | colAlls(X[rows, cols]) | 5.169579 | 4.779157 | 4.695123 | 4.661856 | 4.527997 | 4.7329503 |
Table: Benchmarking of rowAlls_X_S(), rowAlls(X, cols, rows)() and rowAlls(X[cols, rows])() on 100x100 data (transposed). The top panel shows times in milliseconds and the bottom panel shows relative times.
| expr | min | lq | mean | median | uq | max | |
|---|---|---|---|---|---|---|---|
| 1 | rowAlls_X_S | 0.005586 | 0.0060035 | 0.0064399 | 0.0062340 | 0.0064625 | 0.020485 |
| 2 | rowAlls(X, cols, rows) | 0.006963 | 0.0075525 | 0.0081366 | 0.0078550 | 0.0080790 | 0.029651 |
| 3 | rowAlls(X[cols, rows]) | 0.021308 | 0.0217170 | 0.0225564 | 0.0225345 | 0.0227575 | 0.031666 |
| expr | min | lq | mean | median | uq | max | |
|---|---|---|---|---|---|---|---|
| 1 | rowAlls_X_S | 1.000000 | 1.000000 | 1.000000 | 1.000000 | 1.000000 | 1.000000 |
| 2 | rowAlls(X, cols, rows) | 1.246509 | 1.258016 | 1.263477 | 1.260026 | 1.250135 | 1.447449 |
| 3 | rowAlls(X[cols, rows]) | 3.814536 | 3.617390 | 3.502615 | 3.614774 | 3.521470 | 1.545814 |
Figure: Benchmarking of colAlls_X_S(), colAlls(X, rows, cols)() and colAlls(X[rows, cols])() on 100x100 data as well as rowAlls_X_S(), rowAlls(X, cols, rows)() and rowAlls(X[cols, rows])() on the same data transposed. Outliers are displayed as crosses. Times are in milliseconds.
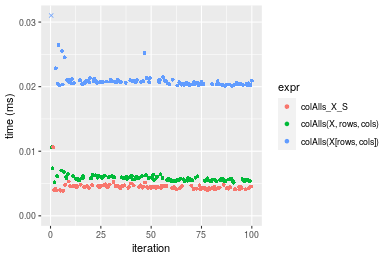
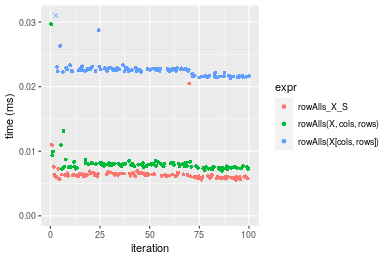 Table: Benchmarking of colAlls_X_S() and rowAlls_X_S() on 100x100 data (original and transposed). The top panel shows times in milliseconds and the bottom panel shows relative times.
| expr | min | lq | mean | median | uq | max | |
|---|---|---|---|---|---|---|---|
| 1 | colAlls_X_S | 3.892 | 4.2700 | 4.50614 | 4.4345 | 4.6165 | 10.616 |
| 2 | rowAlls_X_S | 5.586 | 6.0035 | 6.43988 | 6.2340 | 6.4625 | 20.485 |
| expr | min | lq | mean | median | uq | max | |
|---|---|---|---|---|---|---|---|
| 1 | colAlls_X_S | 1.000000 | 1.000000 | 1.000000 | 1.000000 | 1.00000 | 1.000000 |
| 2 | rowAlls_X_S | 1.435252 | 1.405972 | 1.429134 | 1.405795 | 1.39987 | 1.929634 |
Figure: Benchmarking of colAlls_X_S() and rowAlls_X_S() on 100x100 data (original and transposed). Outliers are displayed as crosses. Times are in milliseconds.
1000x10 matrix
> X <- data[["1000x10"]]
> rows <- sample.int(nrow(X), size = nrow(X) * 0.7)
> cols <- sample.int(ncol(X), size = ncol(X) * 0.7)
> X_S <- X[rows, cols]
> gc()
          used  (Mb) gc trigger  (Mb) max used  (Mb)
Ncells 5153714 275.3    8529671 455.6  8529671 455.6
Vcells 9163506  70.0   31876688 243.2 60562128 462.1
> colStats <- microbenchmark(colAlls_X_S = colAlls(X_S), `colAlls(X, rows, cols)` = colAlls(X, rows = rows,
+     cols = cols), `colAlls(X[rows, cols])` = colAlls(X[rows, cols]), unit = "ms")
> X <- t(X)
> X_S <- t(X_S)
> gc()
          used  (Mb) gc trigger  (Mb) max used  (Mb)
Ncells 5153690 275.3    8529671 455.6  8529671 455.6
Vcells 9168559  70.0   31876688 243.2 60562128 462.1
> rowStats <- microbenchmark(rowAlls_X_S = rowAlls(X_S), `rowAlls(X, cols, rows)` = rowAlls(X, rows = cols,
+     cols = rows), `rowAlls(X[cols, rows])` = rowAlls(X[cols, rows]), unit = "ms")
Table: Benchmarking of colAlls_X_S(), colAlls(X, rows, cols)() and colAlls(X[rows, cols])() on 1000x10 data. The top panel shows times in milliseconds and the bottom panel shows relative times.
| expr | min | lq | mean | median | uq | max | |
|---|---|---|---|---|---|---|---|
| 1 | colAlls_X_S | 0.002936 | 0.0030405 | 0.0031403 | 0.0030970 | 0.0031845 | 0.004853 |
| 2 | colAlls(X, rows, cols) | 0.005964 | 0.0063925 | 0.0067599 | 0.0066375 | 0.0068835 | 0.011604 |
| 3 | colAlls(X[rows, cols]) | 0.019520 | 0.0198600 | 0.0203276 | 0.0200020 | 0.0201410 | 0.044120 |
| expr | min | lq | mean | median | uq | max | |
|---|---|---|---|---|---|---|---|
| 1 | colAlls_X_S | 1.000000 | 1.00000 | 1.000000 | 1.000000 | 1.000000 | 1.000000 |
| 2 | colAlls(X, rows, cols) | 2.031335 | 2.10245 | 2.152658 | 2.143203 | 2.161564 | 2.391098 |
| 3 | colAlls(X[rows, cols]) | 6.648501 | 6.53182 | 6.473197 | 6.458508 | 6.324698 | 9.091284 |
Table: Benchmarking of rowAlls_X_S(), rowAlls(X, cols, rows)() and rowAlls(X[cols, rows])() on 1000x10 data (transposed). The top panel shows times in milliseconds and the bottom panel shows relative times.
| expr | min | lq | mean | median | uq | max | |
|---|---|---|---|---|---|---|---|
| 1 | rowAlls_X_S | 0.006817 | 0.007121 | 0.0075415 | 0.0072500 | 0.0078400 | 0.013378 |
| 2 | rowAlls(X, cols, rows) | 0.010039 | 0.010575 | 0.0109542 | 0.0108300 | 0.0111535 | 0.015914 |
| 3 | rowAlls(X[cols, rows]) | 0.024129 | 0.025382 | 0.0260856 | 0.0257075 | 0.0258975 | 0.052710 |
| expr | min | lq | mean | median | uq | max | |
|---|---|---|---|---|---|---|---|
| 1 | rowAlls_X_S | 1.000000 | 1.000000 | 1.000000 | 1.000000 | 1.000000 | 1.000000 |
| 2 | rowAlls(X, cols, rows) | 1.472642 | 1.485044 | 1.452521 | 1.493793 | 1.422640 | 1.189565 |
| 3 | rowAlls(X[cols, rows]) | 3.539534 | 3.564387 | 3.458923 | 3.545862 | 3.303253 | 3.940051 |
Figure: Benchmarking of colAlls_X_S(), colAlls(X, rows, cols)() and colAlls(X[rows, cols])() on 1000x10 data as well as rowAlls_X_S(), rowAlls(X, cols, rows)() and rowAlls(X[cols, rows])() on the same data transposed. Outliers are displayed as crosses. Times are in milliseconds.
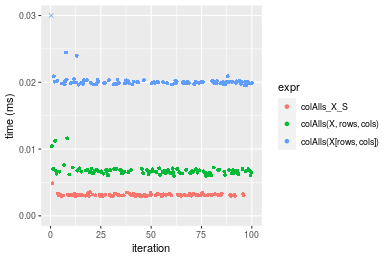
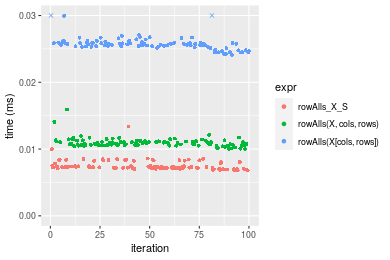 Table: Benchmarking of colAlls_X_S() and rowAlls_X_S() on 1000x10 data (original and transposed). The top panel shows times in milliseconds and the bottom panel shows relative times.
| expr | min | lq | mean | median | uq | max | |
|---|---|---|---|---|---|---|---|
| 1 | colAlls_X_S | 2.936 | 3.0405 | 3.14028 | 3.097 | 3.1845 | 4.853 |
| 2 | rowAlls_X_S | 6.817 | 7.1210 | 7.54153 | 7.250 | 7.8400 | 13.378 |
| expr | min | lq | mean | median | uq | max | |
|---|---|---|---|---|---|---|---|
| 1 | colAlls_X_S | 1.000000 | 1.000000 | 1.000000 | 1.000000 | 1.000000 | 1.000000 |
| 2 | rowAlls_X_S | 2.321867 | 2.342049 | 2.401547 | 2.340975 | 2.461925 | 2.756645 |
Figure: Benchmarking of colAlls_X_S() and rowAlls_X_S() on 1000x10 data (original and transposed). Outliers are displayed as crosses. Times are in milliseconds.
10x1000 matrix
> X <- data[["10x1000"]]
> rows <- sample.int(nrow(X), size = nrow(X) * 0.7)
> cols <- sample.int(ncol(X), size = ncol(X) * 0.7)
> X_S <- X[rows, cols]
> gc()
          used  (Mb) gc trigger  (Mb) max used  (Mb)
Ncells 5153951 275.3    8529671 455.6  8529671 455.6
Vcells 9164338  70.0   31876688 243.2 60562128 462.1
> colStats <- microbenchmark(colAlls_X_S = colAlls(X_S), `colAlls(X, rows, cols)` = colAlls(X, rows = rows,
+     cols = cols), `colAlls(X[rows, cols])` = colAlls(X[rows, cols]), unit = "ms")
> X <- t(X)
> X_S <- t(X_S)
> gc()
          used  (Mb) gc trigger  (Mb) max used  (Mb)
Ncells 5153927 275.3    8529671 455.6  8529671 455.6
Vcells 9169391  70.0   31876688 243.2 60562128 462.1
> rowStats <- microbenchmark(rowAlls_X_S = rowAlls(X_S), `rowAlls(X, cols, rows)` = rowAlls(X, rows = cols,
+     cols = rows), `rowAlls(X[cols, rows])` = rowAlls(X[cols, rows]), unit = "ms")
Table: Benchmarking of colAlls_X_S(), colAlls(X, rows, cols)() and colAlls(X[rows, cols])() on 10x1000 data. The top panel shows times in milliseconds and the bottom panel shows relative times.
| expr | min | lq | mean | median | uq | max | |
|---|---|---|---|---|---|---|---|
| 1 | colAlls_X_S | 0.014275 | 0.014966 | 0.0157981 | 0.0155765 | 0.0161020 | 0.038946 |
| 2 | colAlls(X, rows, cols) | 0.015440 | 0.018539 | 0.0193727 | 0.0193605 | 0.0202080 | 0.034012 |
| 3 | colAlls(X[rows, cols]) | 0.032465 | 0.033170 | 0.0340796 | 0.0338510 | 0.0346055 | 0.040146 |
| expr | min | lq | mean | median | uq | max | |
|---|---|---|---|---|---|---|---|
| 1 | colAlls_X_S | 1.000000 | 1.000000 | 1.000000 | 1.00000 | 1.000000 | 1.0000000 |
| 2 | colAlls(X, rows, cols) | 1.081611 | 1.238741 | 1.226266 | 1.24293 | 1.254999 | 0.8733118 |
| 3 | colAlls(X[rows, cols]) | 2.274256 | 2.216357 | 2.157193 | 2.17321 | 2.149143 | 1.0308119 |
Table: Benchmarking of rowAlls_X_S(), rowAlls(X, cols, rows)() and rowAlls(X[cols, rows])() on 10x1000 data (transposed). The top panel shows times in milliseconds and the bottom panel shows relative times.
| expr | min | lq | mean | median | uq | max | |
|---|---|---|---|---|---|---|---|
| 1 | rowAlls_X_S | 0.011972 | 0.0141355 | 0.0159544 | 0.0156340 | 0.0173540 | 0.032300 |
| 2 | rowAlls(X, cols, rows) | 0.015308 | 0.0191515 | 0.0215045 | 0.0209420 | 0.0227685 | 0.058972 |
| 3 | rowAlls(X[cols, rows]) | 0.029147 | 0.0310165 | 0.0330767 | 0.0325825 | 0.0344510 | 0.048933 |
| expr | min | lq | mean | median | uq | max | |
|---|---|---|---|---|---|---|---|
| 1 | rowAlls_X_S | 1.000000 | 1.000000 | 1.000000 | 1.000000 | 1.000000 | 1.000000 |
| 2 | rowAlls(X, cols, rows) | 1.278650 | 1.354851 | 1.347874 | 1.339516 | 1.312003 | 1.825759 |
| 3 | rowAlls(X[cols, rows]) | 2.434597 | 2.194227 | 2.073209 | 2.084080 | 1.985191 | 1.514954 |
Figure: Benchmarking of colAlls_X_S(), colAlls(X, rows, cols)() and colAlls(X[rows, cols])() on 10x1000 data as well as rowAlls_X_S(), rowAlls(X, cols, rows)() and rowAlls(X[cols, rows])() on the same data transposed. Outliers are displayed as crosses. Times are in milliseconds.
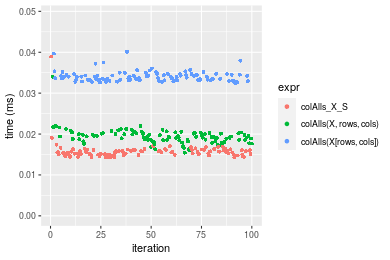
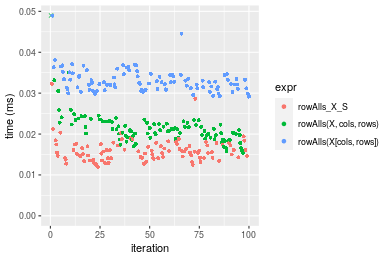 Table: Benchmarking of colAlls_X_S() and rowAlls_X_S() on 10x1000 data (original and transposed). The top panel shows times in milliseconds and the bottom panel shows relative times.
| expr | min | lq | mean | median | uq | max | |
|---|---|---|---|---|---|---|---|
| 1 | colAlls_X_S | 14.275 | 14.9660 | 15.79814 | 15.5765 | 16.102 | 38.946 |
| 2 | rowAlls_X_S | 11.972 | 14.1355 | 15.95437 | 15.6340 | 17.354 | 32.300 |
| expr | min | lq | mean | median | uq | max | |
|---|---|---|---|---|---|---|---|
| 1 | colAlls_X_S | 1.000000 | 1.0000000 | 1.000000 | 1.000000 | 1.000000 | 1.0000000 |
| 2 | rowAlls_X_S | 0.838669 | 0.9445076 | 1.009889 | 1.003691 | 1.077754 | 0.8293535 |
Figure: Benchmarking of colAlls_X_S() and rowAlls_X_S() on 10x1000 data (original and transposed). Outliers are displayed as crosses. Times are in milliseconds.
100x1000 matrix
> X <- data[["100x1000"]]
> rows <- sample.int(nrow(X), size = nrow(X) * 0.7)
> cols <- sample.int(ncol(X), size = ncol(X) * 0.7)
> X_S <- X[rows, cols]
> gc()
          used  (Mb) gc trigger  (Mb) max used  (Mb)
Ncells 5154173 275.3    8529671 455.6  8529671 455.6
Vcells 9187005  70.1   31876688 243.2 60562128 462.1
> colStats <- microbenchmark(colAlls_X_S = colAlls(X_S), `colAlls(X, rows, cols)` = colAlls(X, rows = rows,
+     cols = cols), `colAlls(X[rows, cols])` = colAlls(X[rows, cols]), unit = "ms")
> X <- t(X)
> X_S <- t(X_S)
> gc()
          used  (Mb) gc trigger  (Mb) max used  (Mb)
Ncells 5154149 275.3    8529671 455.6  8529671 455.6
Vcells 9237058  70.5   31876688 243.2 60562128 462.1
> rowStats <- microbenchmark(rowAlls_X_S = rowAlls(X_S), `rowAlls(X, cols, rows)` = rowAlls(X, rows = cols,
+     cols = rows), `rowAlls(X[cols, rows])` = rowAlls(X[cols, rows]), unit = "ms")
Table: Benchmarking of colAlls_X_S(), colAlls(X, rows, cols)() and colAlls(X[rows, cols])() on 100x1000 data. The top panel shows times in milliseconds and the bottom panel shows relative times.
| expr | min | lq | mean | median | uq | max | |
|---|---|---|---|---|---|---|---|
| 1 | colAlls_X_S | 0.013862 | 0.0164300 | 0.0179002 | 0.0174005 | 0.0185255 | 0.054121 |
| 2 | colAlls(X, rows, cols) | 0.017819 | 0.0215875 | 0.0232370 | 0.0227030 | 0.0244085 | 0.058309 |
| 3 | colAlls(X[rows, cols]) | 0.137943 | 0.1502875 | 0.1604234 | 0.1617350 | 0.1678650 | 0.206960 |
| expr | min | lq | mean | median | uq | max | |
|---|---|---|---|---|---|---|---|
| 1 | colAlls_X_S | 1.000000 | 1.000000 | 1.000000 | 1.000000 | 1.000000 | 1.000000 |
| 2 | colAlls(X, rows, cols) | 1.285457 | 1.313908 | 1.298145 | 1.304733 | 1.317562 | 1.077382 |
| 3 | colAlls(X[rows, cols]) | 9.951161 | 9.147139 | 8.962128 | 9.294848 | 9.061294 | 3.824024 |
Table: Benchmarking of rowAlls_X_S(), rowAlls(X, cols, rows)() and rowAlls(X[cols, rows])() on 100x1000 data (transposed). The top panel shows times in milliseconds and the bottom panel shows relative times.
| expr | min | lq | mean | median | uq | max | |
|---|---|---|---|---|---|---|---|
| 1 | rowAlls_X_S | 0.033167 | 0.0356275 | 0.0384009 | 0.0377135 | 0.0398360 | 0.071937 |
| 2 | rowAlls(X, cols, rows) | 0.039492 | 0.0429860 | 0.0465241 | 0.0453340 | 0.0474345 | 0.086056 |
| 3 | rowAlls(X[cols, rows]) | 0.178062 | 0.1850315 | 0.1889066 | 0.1878170 | 0.1900360 | 0.239919 |
| expr | min | lq | mean | median | uq | max | |
|---|---|---|---|---|---|---|---|
| 1 | rowAlls_X_S | 1.000000 | 1.000000 | 1.000000 | 1.000000 | 1.000000 | 1.000000 |
| 2 | rowAlls(X, cols, rows) | 1.190702 | 1.206540 | 1.211536 | 1.202063 | 1.190745 | 1.196269 |
| 3 | rowAlls(X[cols, rows]) | 5.368650 | 5.193502 | 4.919325 | 4.980100 | 4.770459 | 3.335127 |
Figure: Benchmarking of colAlls_X_S(), colAlls(X, rows, cols)() and colAlls(X[rows, cols])() on 100x1000 data as well as rowAlls_X_S(), rowAlls(X, cols, rows)() and rowAlls(X[cols, rows])() on the same data transposed. Outliers are displayed as crosses. Times are in milliseconds.
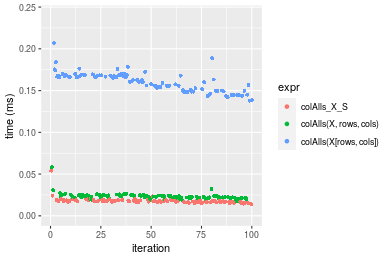
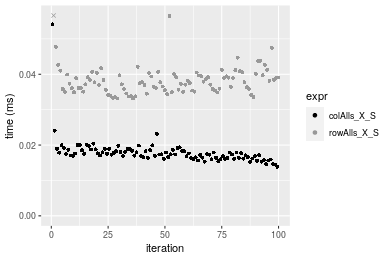
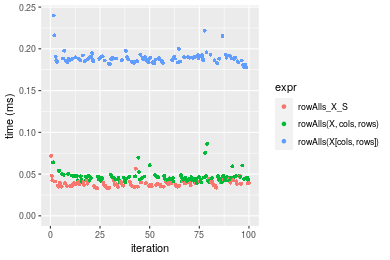 Table: Benchmarking of colAlls_X_S() and rowAlls_X_S() on 100x1000 data (original and transposed). The top panel shows times in milliseconds and the bottom panel shows relative times.
| expr | min | lq | mean | median | uq | max | |
|---|---|---|---|---|---|---|---|
| 1 | colAlls_X_S | 13.862 | 16.4300 | 17.90015 | 17.4005 | 18.5255 | 54.121 |
| 2 | rowAlls_X_S | 33.167 | 35.6275 | 38.40092 | 37.7135 | 39.8360 | 71.937 |
| expr | min | lq | mean | median | uq | max | |
|---|---|---|---|---|---|---|---|
| 1 | colAlls_X_S | 1.000000 | 1.000000 | 1.000000 | 1.00000 | 1.000000 | 1.000000 |
| 2 | rowAlls_X_S | 2.392656 | 2.168442 | 2.145285 | 2.16738 | 2.150333 | 1.329188 |
Figure: Benchmarking of colAlls_X_S() and rowAlls_X_S() on 100x1000 data (original and transposed). Outliers are displayed as crosses. Times are in milliseconds.
1000x100 matrix
> X <- data[["1000x100"]]
> rows <- sample.int(nrow(X), size = nrow(X) * 0.7)
> cols <- sample.int(ncol(X), size = ncol(X) * 0.7)
> X_S <- X[rows, cols]
> gc()
          used  (Mb) gc trigger  (Mb) max used  (Mb)
Ncells 5154389 275.3    8529671 455.6  8529671 455.6
Vcells 9187674  70.1   31876688 243.2 60562128 462.1
> colStats <- microbenchmark(colAlls_X_S = colAlls(X_S), `colAlls(X, rows, cols)` = colAlls(X, rows = rows,
+     cols = cols), `colAlls(X[rows, cols])` = colAlls(X[rows, cols]), unit = "ms")
> X <- t(X)
> X_S <- t(X_S)
> gc()
          used  (Mb) gc trigger  (Mb) max used  (Mb)
Ncells 5154365 275.3    8529671 455.6  8529671 455.6
Vcells 9237727  70.5   31876688 243.2 60562128 462.1
> rowStats <- microbenchmark(rowAlls_X_S = rowAlls(X_S), `rowAlls(X, cols, rows)` = rowAlls(X, rows = cols,
+     cols = rows), `rowAlls(X[cols, rows])` = rowAlls(X[cols, rows]), unit = "ms")
Table: Benchmarking of colAlls_X_S(), colAlls(X, rows, cols)() and colAlls(X[rows, cols])() on 1000x100 data. The top panel shows times in milliseconds and the bottom panel shows relative times.
| expr | min | lq | mean | median | uq | max | |
|---|---|---|---|---|---|---|---|
| 1 | colAlls_X_S | 0.003264 | 0.0040010 | 0.0045915 | 0.004333 | 0.0046710 | 0.024459 |
| 2 | colAlls(X, rows, cols) | 0.006482 | 0.0073745 | 0.0081240 | 0.007878 | 0.0085775 | 0.018071 |
| 3 | colAlls(X[rows, cols]) | 0.126256 | 0.1358400 | 0.1436834 | 0.141249 | 0.1529790 | 0.204710 |
| expr | min | lq | mean | median | uq | max | |
|---|---|---|---|---|---|---|---|
| 1 | colAlls_X_S | 1.000000 | 1.000000 | 1.000000 | 1.00000 | 1.000000 | 1.0000000 |
| 2 | colAlls(X, rows, cols) | 1.985907 | 1.843164 | 1.769369 | 1.81814 | 1.836331 | 0.7388282 |
| 3 | colAlls(X[rows, cols]) | 38.681373 | 33.951512 | 31.293683 | 32.59843 | 32.750803 | 8.3695163 |
Table: Benchmarking of rowAlls_X_S(), rowAlls(X, cols, rows)() and rowAlls(X[cols, rows])() on 1000x100 data (transposed). The top panel shows times in milliseconds and the bottom panel shows relative times.
| expr | min | lq | mean | median | uq | max | |
|---|---|---|---|---|---|---|---|
| 1 | rowAlls_X_S | 0.021818 | 0.0224805 | 0.0250644 | 0.0246440 | 0.0263895 | 0.048487 |
| 2 | rowAlls(X, cols, rows) | 0.025328 | 0.0269640 | 0.0297502 | 0.0288350 | 0.0307975 | 0.056401 |
| 3 | rowAlls(X[cols, rows]) | 0.140504 | 0.1419800 | 0.1573729 | 0.1565415 | 0.1695720 | 0.239202 |
| expr | min | lq | mean | median | uq | max | |
|---|---|---|---|---|---|---|---|
| 1 | rowAlls_X_S | 1.000000 | 1.000000 | 1.000000 | 1.000000 | 1.000000 | 1.000000 |
| 2 | rowAlls(X, cols, rows) | 1.160876 | 1.199439 | 1.186950 | 1.170062 | 1.167036 | 1.163219 |
| 3 | rowAlls(X[cols, rows]) | 6.439820 | 6.315696 | 6.278739 | 6.352114 | 6.425738 | 4.933322 |
Figure: Benchmarking of colAlls_X_S(), colAlls(X, rows, cols)() and colAlls(X[rows, cols])() on 1000x100 data as well as rowAlls_X_S(), rowAlls(X, cols, rows)() and rowAlls(X[cols, rows])() on the same data transposed. Outliers are displayed as crosses. Times are in milliseconds.
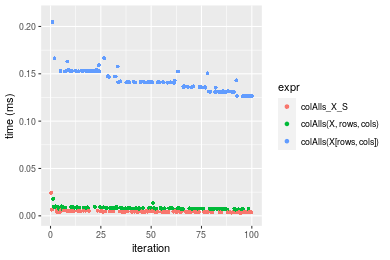
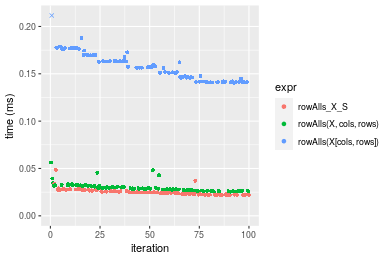 Table: Benchmarking of colAlls_X_S() and rowAlls_X_S() on 1000x100 data (original and transposed). The top panel shows times in milliseconds and the bottom panel shows relative times.
| expr | min | lq | mean | median | uq | max | |
|---|---|---|---|---|---|---|---|
| 1 | colAlls_X_S | 3.264 | 4.0010 | 4.59145 | 4.333 | 4.6710 | 24.459 |
| 2 | rowAlls_X_S | 21.818 | 22.4805 | 25.06442 | 24.644 | 26.3895 | 48.487 |
| expr | min | lq | mean | median | uq | max | |
|---|---|---|---|---|---|---|---|
| 1 | colAlls_X_S | 1.000000 | 1.00000 | 1.000000 | 1.000000 | 1.000000 | 1.000000 |
| 2 | rowAlls_X_S | 6.684436 | 5.61872 | 5.458933 | 5.687514 | 5.649647 | 1.982379 |
Figure: Benchmarking of colAlls_X_S() and rowAlls_X_S() on 1000x100 data (original and transposed). Outliers are displayed as crosses. Times are in milliseconds.
Appendix
Session information
R version 4.1.1 Patched (2021-08-10 r80727)
Platform: x86_64-pc-linux-gnu (64-bit)
Running under: Ubuntu 18.04.5 LTS

Matrix products: default
BLAS:   /home/hb/software/R-devel/R-4-1-branch/lib/R/lib/libRblas.so
LAPACK: /home/hb/software/R-devel/R-4-1-branch/lib/R/lib/libRlapack.so

locale:
 [1] LC_CTYPE=en_US.UTF-8       LC_NUMERIC=C
 [3] LC_TIME=en_US.UTF-8        LC_COLLATE=en_US.UTF-8
 [5] LC_MONETARY=en_US.UTF-8    LC_MESSAGES=en_US.UTF-8
 [7] LC_PAPER=en_US.UTF-8       LC_NAME=C
 [9] LC_ADDRESS=C               LC_TELEPHONE=C
[11] LC_MEASUREMENT=en_US.UTF-8 LC_IDENTIFICATION=C

attached base packages:
[1] stats     graphics  grDevices utils     datasets  methods   base

other attached packages:
[1] microbenchmark_1.4-7   matrixStats_0.60.1     ggplot2_3.3.5
[4] knitr_1.33             R.devices_2.17.0       R.utils_2.10.1
[7] R.oo_1.24.0            R.methodsS3_1.8.1-9001 history_0.0.1-9000

loaded via a namespace (and not attached):
 [1] Biobase_2.52.0          httr_1.4.2              splines_4.1.1
 [4] bit64_4.0.5             network_1.17.1          assertthat_0.2.1
 [7] highr_0.9               stats4_4.1.1            blob_1.2.2
[10] GenomeInfoDbData_1.2.6  robustbase_0.93-8       pillar_1.6.2
[13] RSQLite_2.2.8           lattice_0.20-44         glue_1.4.2
[16] digest_0.6.27           XVector_0.32.0          colorspace_2.0-2
[19] Matrix_1.3-4            XML_3.99-0.7            pkgconfig_2.0.3
[22] zlibbioc_1.38.0         genefilter_1.74.0       purrr_0.3.4
[25] ergm_4.1.2              xtable_1.8-4            scales_1.1.1
[28] tibble_3.1.4            annotate_1.70.0         KEGGREST_1.32.0
[31] farver_2.1.0            generics_0.1.0          IRanges_2.26.0
[34] ellipsis_0.3.2          cachem_1.0.6            withr_2.4.2
[37] BiocGenerics_0.38.0     mime_0.11               survival_3.2-13
[40] magrittr_2.0.1          crayon_1.4.1            statnet.common_4.5.0
[43] memoise_2.0.0           laeken_0.5.1            fansi_0.5.0
[46] R.cache_0.15.0          MASS_7.3-54             R.rsp_0.44.0
[49] progressr_0.8.0         tools_4.1.1             lifecycle_1.0.0
[52] S4Vectors_0.30.0        trust_0.1-8             munsell_0.5.0
[55] tabby_0.0.1-9001        AnnotationDbi_1.54.1    Biostrings_2.60.2
[58] compiler_4.1.1          GenomeInfoDb_1.28.1     rlang_0.4.11
[61] grid_4.1.1              RCurl_1.98-1.4          cwhmisc_6.6
[64] rappdirs_0.3.3          startup_0.15.0          labeling_0.4.2
[67] bitops_1.0-7            base64enc_0.1-3         boot_1.3-28
[70] gtable_0.3.0            DBI_1.1.1               markdown_1.1
[73] R6_2.5.1                lpSolveAPI_5.5.2.0-17.7 rle_0.9.2
[76] dplyr_1.0.7             fastmap_1.1.0           bit_4.0.4
[79] utf8_1.2.2              parallel_4.1.1          Rcpp_1.0.7
[82] vctrs_0.3.8             png_0.1-7               DEoptimR_1.0-9
[85] tidyselect_1.1.1        xfun_0.25               coda_0.19-4
Total processing time was 11.09 secs.
Reproducibility
To reproduce this report, do:
html <- matrixStats:::benchmark('colRowAlls_subset')
Copyright Dongcan Jiang. Last updated on 2021-08-25 18:49:36 (+0200 UTC). Powered by RSP.