matrixStats.benchmarks
weightedMean() benchmarks on subsetted computation
This report benchmark the performance of weightedMean() on subsetted computation.
Data type “integer”
Data
> rvector <- function(n, mode = c("logical", "double", "integer"), range = c(-100, +100), na_prob = 0) {
+     mode <- match.arg(mode)
+     if (mode == "logical") {
+         x <- sample(c(FALSE, TRUE), size = n, replace = TRUE)
+     }     else {
+         x <- runif(n, min = range[1], max = range[2])
+     }
+     storage.mode(x) <- mode
+     if (na_prob > 0)
+         x[sample(n, size = na_prob * n)] <- NA
+     x
+ }
> rvectors <- function(scale = 10, seed = 1, ...) {
+     set.seed(seed)
+     data <- list()
+     data[[1]] <- rvector(n = scale * 100, ...)
+     data[[2]] <- rvector(n = scale * 1000, ...)
+     data[[3]] <- rvector(n = scale * 10000, ...)
+     data[[4]] <- rvector(n = scale * 1e+05, ...)
+     data[[5]] <- rvector(n = scale * 1e+06, ...)
+     names(data) <- sprintf("n = %d", sapply(data, FUN = length))
+     data
+ }
> data <- rvectors(mode = mode)
> data <- data[1:4]
Results
n = 1000 vector
> x <- data[["n = 1000"]]
> idxs <- sample.int(length(x), size = length(x) * 0.7)
> x_S <- x[idxs]
> w <- runif(length(x))
> w_S <- w[idxs]
> gc()
           used  (Mb) gc trigger  (Mb) max used  (Mb)
Ncells  5364362 286.5    7916910 422.9  7916910 422.9
Vcells 12034510  91.9   39038428 297.9 94934136 724.3
> stats <- microbenchmark(weightedMean_x_w_S = weightedMean(x_S, w = w_S, na.rm = FALSE), `weightedMean(x, w, idxs)` = weightedMean(x,
+     w = w, idxs = idxs, na.rm = FALSE), `weightedMean(x[idxs], w[idxs])` = weightedMean(x[idxs],
+     w = w[idxs], na.rm = FALSE), unit = "ms")
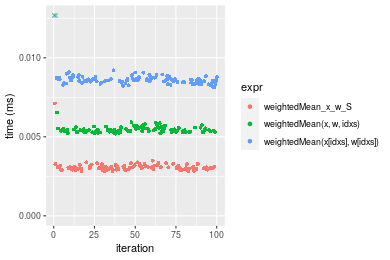
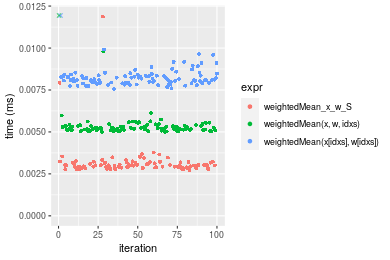
Table: Benchmarking of weightedMean_x_w_S(), weightedMean(x, w, idxs)() and weightedMean(x[idxs], w[idxs])() on integer+n = 1000 data. The top panel shows times in milliseconds and the bottom panel shows relative times.
| expr | min | lq | mean | median | uq | max | |
|---|---|---|---|---|---|---|---|
| 1 | weightedMean_x_w_S | 0.002821 | 0.0029570 | 0.0031039 | 0.0030480 | 0.0031595 | 0.007110 |
| 2 | weightedMean(x, w, idxs) | 0.005202 | 0.0053205 | 0.0066958 | 0.0054110 | 0.0055410 | 0.129686 |
| 3 | weightedMean(x[idxs], w[idxs]) | 0.008130 | 0.0084415 | 0.0086508 | 0.0085765 | 0.0087490 | 0.013860 |
| expr | min | lq | mean | median | uq | max | |
|---|---|---|---|---|---|---|---|
| 1 | weightedMean_x_w_S | 1.000000 | 1.000000 | 1.000000 | 1.000000 | 1.000000 | 1.000000 |
| 2 | weightedMean(x, w, idxs) | 1.844027 | 1.799290 | 2.157201 | 1.775262 | 1.753758 | 18.239944 |
| 3 | weightedMean(x[idxs], w[idxs]) | 2.881957 | 2.854751 | 2.787031 | 2.813812 | 2.769109 | 1.949367 |
Figure: Benchmarking of weightedMean_x_w_S(), weightedMean(x, w, idxs)() and weightedMean(x[idxs], w[idxs])() on integer+n = 1000 data. Outliers are displayed as crosses. Times are in milliseconds.
n = 10000 vector
> x <- data[["n = 10000"]]
> idxs <- sample.int(length(x), size = length(x) * 0.7)
> x_S <- x[idxs]
> w <- runif(length(x))
> w_S <- w[idxs]
> gc()
           used  (Mb) gc trigger  (Mb) max used  (Mb)
Ncells  5361363 286.4    7916910 422.9  7916910 422.9
Vcells 10918644  83.4   39038428 297.9 94934136 724.3
> stats <- microbenchmark(weightedMean_x_w_S = weightedMean(x_S, w = w_S, na.rm = FALSE), `weightedMean(x, w, idxs)` = weightedMean(x,
+     w = w, idxs = idxs, na.rm = FALSE), `weightedMean(x[idxs], w[idxs])` = weightedMean(x[idxs],
+     w = w[idxs], na.rm = FALSE), unit = "ms")
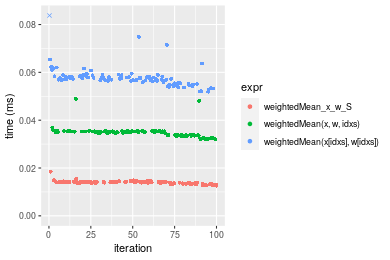
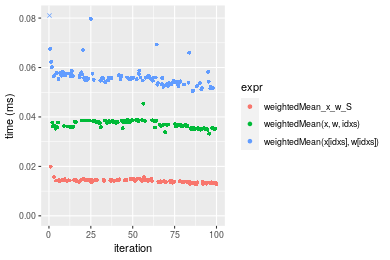
Table: Benchmarking of weightedMean_x_w_S(), weightedMean(x, w, idxs)() and weightedMean(x[idxs], w[idxs])() on integer+n = 10000 data. The top panel shows times in milliseconds and the bottom panel shows relative times.
| expr | min | lq | mean | median | uq | max | |
|---|---|---|---|---|---|---|---|
| 1 | weightedMean_x_w_S | 0.012654 | 0.0135785 | 0.0139364 | 0.0140310 | 0.0142200 | 0.018458 |
| 2 | weightedMean(x, w, idxs) | 0.031982 | 0.0338120 | 0.0348139 | 0.0349095 | 0.0352880 | 0.048945 |
| 3 | weightedMean(x[idxs], w[idxs]) | 0.051941 | 0.0558815 | 0.0579876 | 0.0573350 | 0.0582205 | 0.111312 |
| expr | min | lq | mean | median | uq | max | |
|---|---|---|---|---|---|---|---|
| 1 | weightedMean_x_w_S | 1.000000 | 1.000000 | 1.000000 | 1.000000 | 1.000000 | 1.000000 |
| 2 | weightedMean(x, w, idxs) | 2.527422 | 2.490113 | 2.498053 | 2.488027 | 2.481575 | 2.651696 |
| 3 | weightedMean(x[idxs], w[idxs]) | 4.104710 | 4.115440 | 4.160875 | 4.086309 | 4.094269 | 6.030556 |
Figure: Benchmarking of weightedMean_x_w_S(), weightedMean(x, w, idxs)() and weightedMean(x[idxs], w[idxs])() on integer+n = 10000 data. Outliers are displayed as crosses. Times are in milliseconds.
n = 100000 vector
> x <- data[["n = 100000"]]
> idxs <- sample.int(length(x), size = length(x) * 0.7)
> x_S <- x[idxs]
> w <- runif(length(x))
> w_S <- w[idxs]
> gc()
           used  (Mb) gc trigger  (Mb) max used  (Mb)
Ncells  5361435 286.4    7916910 422.9  7916910 422.9
Vcells 11135204  85.0   39038428 297.9 94934136 724.3
> stats <- microbenchmark(weightedMean_x_w_S = weightedMean(x_S, w = w_S, na.rm = FALSE), `weightedMean(x, w, idxs)` = weightedMean(x,
+     w = w, idxs = idxs, na.rm = FALSE), `weightedMean(x[idxs], w[idxs])` = weightedMean(x[idxs],
+     w = w[idxs], na.rm = FALSE), unit = "ms")
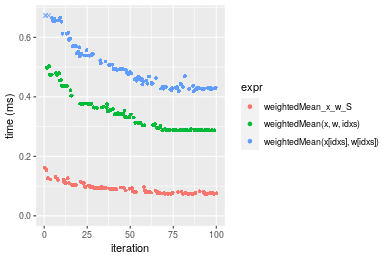
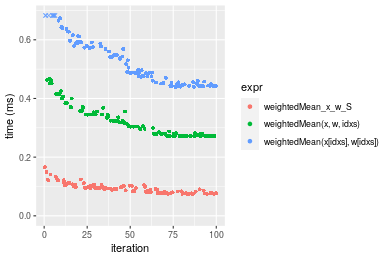
Table: Benchmarking of weightedMean_x_w_S(), weightedMean(x, w, idxs)() and weightedMean(x[idxs], w[idxs])() on integer+n = 100000 data. The top panel shows times in milliseconds and the bottom panel shows relative times.
| expr | min | lq | mean | median | uq | max | |
|---|---|---|---|---|---|---|---|
| 1 | weightedMean_x_w_S | 0.073923 | 0.0765635 | 0.0912346 | 0.0899155 | 0.0970435 | 0.161012 |
| 2 | weightedMean(x, w, idxs) | 0.287454 | 0.2879120 | 0.3420530 | 0.3307135 | 0.3759950 | 0.502973 |
| 3 | weightedMean(x[idxs], w[idxs]) | 0.418547 | 0.4328960 | 0.5059765 | 0.4798890 | 0.5474805 | 0.950473 |
| expr | min | lq | mean | median | uq | max | |
|---|---|---|---|---|---|---|---|
| 1 | weightedMean_x_w_S | 1.000000 | 1.000000 | 1.000000 | 1.000000 | 1.000000 | 1.000000 |
| 2 | weightedMean(x, w, idxs) | 3.888560 | 3.760434 | 3.749157 | 3.678048 | 3.874500 | 3.123823 |
| 3 | weightedMean(x[idxs], w[idxs]) | 5.661932 | 5.654078 | 5.545881 | 5.337111 | 5.641599 | 5.903119 |
Figure: Benchmarking of weightedMean_x_w_S(), weightedMean(x, w, idxs)() and weightedMean(x[idxs], w[idxs])() on integer+n = 100000 data. Outliers are displayed as crosses. Times are in milliseconds.
n = 1000000 vector
> x <- data[["n = 1000000"]]
> idxs <- sample.int(length(x), size = length(x) * 0.7)
> x_S <- x[idxs]
> w <- runif(length(x))
> w_S <- w[idxs]
> gc()
           used  (Mb) gc trigger  (Mb) max used  (Mb)
Ncells  5361507 286.4    7916910 422.9  7916910 422.9
Vcells 13295253 101.5   39038428 297.9 94934136 724.3
> stats <- microbenchmark(weightedMean_x_w_S = weightedMean(x_S, w = w_S, na.rm = FALSE), `weightedMean(x, w, idxs)` = weightedMean(x,
+     w = w, idxs = idxs, na.rm = FALSE), `weightedMean(x[idxs], w[idxs])` = weightedMean(x[idxs],
+     w = w[idxs], na.rm = FALSE), unit = "ms")
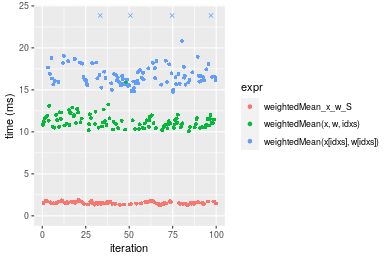
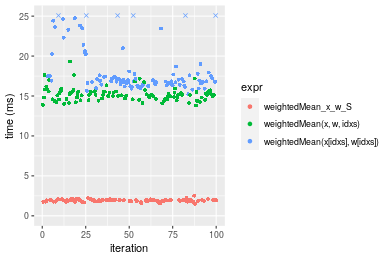
Table: Benchmarking of weightedMean_x_w_S(), weightedMean(x, w, idxs)() and weightedMean(x[idxs], w[idxs])() on integer+n = 1000000 data. The top panel shows times in milliseconds and the bottom panel shows relative times.
| expr | min | lq | mean | median | uq | max | |
|---|---|---|---|---|---|---|---|
| 1 | weightedMean_x_w_S | 1.286749 | 1.427382 | 1.535879 | 1.527029 | 1.654472 | 1.88446 |
| 2 | weightedMean(x, w, idxs) | 10.074159 | 10.625079 | 11.300622 | 11.087812 | 11.680366 | 15.90543 |
| 3 | weightedMean(x[idxs], w[idxs]) | 14.757923 | 15.847532 | 17.258122 | 16.399470 | 17.400435 | 37.19970 |
| expr | min | lq | mean | median | uq | max | |
|---|---|---|---|---|---|---|---|
| 1 | weightedMean_x_w_S | 1.000000 | 1.00000 | 1.000000 | 1.000000 | 1.000000 | 1.000000 |
| 2 | weightedMean(x, w, idxs) | 7.829156 | 7.44375 | 7.357755 | 7.261036 | 7.059876 | 8.440312 |
| 3 | weightedMean(x[idxs], w[idxs]) | 11.469154 | 11.10251 | 11.236641 | 10.739462 | 10.517213 | 19.740245 |
Figure: Benchmarking of weightedMean_x_w_S(), weightedMean(x, w, idxs)() and weightedMean(x[idxs], w[idxs])() on integer+n = 1000000 data. Outliers are displayed as crosses. Times are in milliseconds.
Data type “double”
Data
> rvector <- function(n, mode = c("logical", "double", "integer"), range = c(-100, +100), na_prob = 0) {
+     mode <- match.arg(mode)
+     if (mode == "logical") {
+         x <- sample(c(FALSE, TRUE), size = n, replace = TRUE)
+     }     else {
+         x <- runif(n, min = range[1], max = range[2])
+     }
+     storage.mode(x) <- mode
+     if (na_prob > 0)
+         x[sample(n, size = na_prob * n)] <- NA
+     x
+ }
> rvectors <- function(scale = 10, seed = 1, ...) {
+     set.seed(seed)
+     data <- list()
+     data[[1]] <- rvector(n = scale * 100, ...)
+     data[[2]] <- rvector(n = scale * 1000, ...)
+     data[[3]] <- rvector(n = scale * 10000, ...)
+     data[[4]] <- rvector(n = scale * 1e+05, ...)
+     data[[5]] <- rvector(n = scale * 1e+06, ...)
+     names(data) <- sprintf("n = %d", sapply(data, FUN = length))
+     data
+ }
> data <- rvectors(mode = mode)
> data <- data[1:4]
Results
n = 1000 vector
> x <- data[["n = 1000"]]
> idxs <- sample.int(length(x), size = length(x) * 0.7)
> x_S <- x[idxs]
> w <- runif(length(x))
> w_S <- w[idxs]
> gc()
           used  (Mb) gc trigger  (Mb) max used  (Mb)
Ncells  5361588 286.4    7916910 422.9  7916910 422.9
Vcells 11454142  87.4   39038428 297.9 94934136 724.3
> stats <- microbenchmark(weightedMean_x_w_S = weightedMean(x_S, w = w_S, na.rm = FALSE), `weightedMean(x, w, idxs)` = weightedMean(x,
+     w = w, idxs = idxs, na.rm = FALSE), `weightedMean(x[idxs], w[idxs])` = weightedMean(x[idxs],
+     w = w[idxs], na.rm = FALSE), unit = "ms")
Table: Benchmarking of weightedMean_x_w_S(), weightedMean(x, w, idxs)() and weightedMean(x[idxs], w[idxs])() on double+n = 1000 data. The top panel shows times in milliseconds and the bottom panel shows relative times.
| expr | min | lq | mean | median | uq | max | |
|---|---|---|---|---|---|---|---|
| 1 | weightedMean_x_w_S | 0.002738 | 0.0028760 | 0.0031660 | 0.0029950 | 0.0031620 | 0.011875 |
| 2 | weightedMean(x, w, idxs) | 0.005010 | 0.0051085 | 0.0056244 | 0.0052010 | 0.0053665 | 0.037112 |
| 3 | weightedMean(x[idxs], w[idxs]) | 0.007567 | 0.0079210 | 0.0082990 | 0.0081335 | 0.0083645 | 0.015526 |
| expr | min | lq | mean | median | uq | max | |
|---|---|---|---|---|---|---|---|
| 1 | weightedMean_x_w_S | 1.000000 | 1.000000 | 1.000000 | 1.000000 | 1.000000 | 1.000000 |
| 2 | weightedMean(x, w, idxs) | 1.829803 | 1.776252 | 1.776524 | 1.736561 | 1.697185 | 3.125221 |
| 3 | weightedMean(x[idxs], w[idxs]) | 2.763696 | 2.754173 | 2.621312 | 2.715693 | 2.645319 | 1.307453 |
Figure: Benchmarking of weightedMean_x_w_S(), weightedMean(x, w, idxs)() and weightedMean(x[idxs], w[idxs])() on double+n = 1000 data. Outliers are displayed as crosses. Times are in milliseconds.
n = 10000 vector
> x <- data[["n = 10000"]]
> idxs <- sample.int(length(x), size = length(x) * 0.7)
> x_S <- x[idxs]
> w <- runif(length(x))
> w_S <- w[idxs]
> gc()
           used  (Mb) gc trigger  (Mb) max used  (Mb)
Ncells  5361651 286.4    7916910 422.9  7916910 422.9
Vcells 11479244  87.6   39038428 297.9 94934136 724.3
> stats <- microbenchmark(weightedMean_x_w_S = weightedMean(x_S, w = w_S, na.rm = FALSE), `weightedMean(x, w, idxs)` = weightedMean(x,
+     w = w, idxs = idxs, na.rm = FALSE), `weightedMean(x[idxs], w[idxs])` = weightedMean(x[idxs],
+     w = w[idxs], na.rm = FALSE), unit = "ms")
Table: Benchmarking of weightedMean_x_w_S(), weightedMean(x, w, idxs)() and weightedMean(x[idxs], w[idxs])() on double+n = 10000 data. The top panel shows times in milliseconds and the bottom panel shows relative times.
| expr | min | lq | mean | median | uq | max | |
|---|---|---|---|---|---|---|---|
| 1 | weightedMean_x_w_S | 0.012747 | 0.0136515 | 0.0141336 | 0.014172 | 0.0144765 | 0.019885 |
| 2 | weightedMean(x, w, idxs) | 0.033253 | 0.0359785 | 0.0370993 | 0.037671 | 0.0381220 | 0.045359 |
| 3 | weightedMean(x[idxs], w[idxs]) | 0.050475 | 0.0540690 | 0.0565772 | 0.055710 | 0.0570075 | 0.105376 |
| expr | min | lq | mean | median | uq | max | |
|---|---|---|---|---|---|---|---|
| 1 | weightedMean_x_w_S | 1.000000 | 1.000000 | 1.000000 | 1.000000 | 1.000000 | 1.000000 |
| 2 | weightedMean(x, w, idxs) | 2.608692 | 2.635498 | 2.624899 | 2.658129 | 2.633371 | 2.281066 |
| 3 | weightedMean(x[idxs], w[idxs]) | 3.959755 | 3.960664 | 4.003024 | 3.930991 | 3.937934 | 5.299271 |
Figure: Benchmarking of weightedMean_x_w_S(), weightedMean(x, w, idxs)() and weightedMean(x[idxs], w[idxs])() on double+n = 10000 data. Outliers are displayed as crosses. Times are in milliseconds.
n = 100000 vector
> x <- data[["n = 100000"]]
> idxs <- sample.int(length(x), size = length(x) * 0.7)
> x_S <- x[idxs]
> w <- runif(length(x))
> w_S <- w[idxs]
> gc()
           used  (Mb) gc trigger  (Mb) max used  (Mb)
Ncells  5361723 286.4    7916910 422.9  7916910 422.9
Vcells 11726792  89.5   39038428 297.9 94934136 724.3
> stats <- microbenchmark(weightedMean_x_w_S = weightedMean(x_S, w = w_S, na.rm = FALSE), `weightedMean(x, w, idxs)` = weightedMean(x,
+     w = w, idxs = idxs, na.rm = FALSE), `weightedMean(x[idxs], w[idxs])` = weightedMean(x[idxs],
+     w = w[idxs], na.rm = FALSE), unit = "ms")
Table: Benchmarking of weightedMean_x_w_S(), weightedMean(x, w, idxs)() and weightedMean(x[idxs], w[idxs])() on double+n = 100000 data. The top panel shows times in milliseconds and the bottom panel shows relative times.
| expr | min | lq | mean | median | uq | max | |
|---|---|---|---|---|---|---|---|
| 1 | weightedMean_x_w_S | 0.074574 | 0.0777810 | 0.0933247 | 0.0911825 | 0.1018505 | 0.166096 |
| 2 | weightedMean(x, w, idxs) | 0.271479 | 0.2733125 | 0.3220694 | 0.3048190 | 0.3491850 | 0.466553 |
| 3 | weightedMean(x[idxs], w[idxs]) | 0.439524 | 0.4530610 | 0.5358237 | 0.4976995 | 0.5902920 | 1.086346 |
| expr | min | lq | mean | median | uq | max | |
|---|---|---|---|---|---|---|---|
| 1 | weightedMean_x_w_S | 1.000000 | 1.000000 | 1.000000 | 1.000000 | 1.000000 | 1.000000 |
| 2 | weightedMean(x, w, idxs) | 3.640398 | 3.513872 | 3.451062 | 3.342955 | 3.428407 | 2.808936 |
| 3 | weightedMean(x[idxs], w[idxs]) | 5.893797 | 5.824829 | 5.741498 | 5.458279 | 5.795671 | 6.540471 |
Figure: Benchmarking of weightedMean_x_w_S(), weightedMean(x, w, idxs)() and weightedMean(x[idxs], w[idxs])() on double+n = 100000 data. Outliers are displayed as crosses. Times are in milliseconds.
n = 1000000 vector
> x <- data[["n = 1000000"]]
> idxs <- sample.int(length(x), size = length(x) * 0.7)
> x_S <- x[idxs]
> w <- runif(length(x))
> w_S <- w[idxs]
> gc()
           used  (Mb) gc trigger  (Mb) max used  (Mb)
Ncells  5361795 286.4    7916910 422.9  7916910 422.9
Vcells 14202252 108.4   39038428 297.9 94934136 724.3
> stats <- microbenchmark(weightedMean_x_w_S = weightedMean(x_S, w = w_S, na.rm = FALSE), `weightedMean(x, w, idxs)` = weightedMean(x,
+     w = w, idxs = idxs, na.rm = FALSE), `weightedMean(x[idxs], w[idxs])` = weightedMean(x[idxs],
+     w = w[idxs], na.rm = FALSE), unit = "ms")
Table: Benchmarking of weightedMean_x_w_S(), weightedMean(x, w, idxs)() and weightedMean(x[idxs], w[idxs])() on double+n = 1000000 data. The top panel shows times in milliseconds and the bottom panel shows relative times.
| expr | min | lq | mean | median | uq | max | |
|---|---|---|---|---|---|---|---|
| 1 | weightedMean_x_w_S | 1.511921 | 1.84086 | 1.912257 | 1.941781 | 1.981162 | 2.531397 |
| 2 | weightedMean(x, w, idxs) | 13.814567 | 14.64531 | 15.219553 | 15.139641 | 15.541518 | 19.309926 |
| 3 | weightedMean(x[idxs], w[idxs]) | 15.237176 | 16.49040 | 18.206407 | 16.900016 | 17.856372 | 26.186519 |
| expr | min | lq | mean | median | uq | max | |
|---|---|---|---|---|---|---|---|
| 1 | weightedMean_x_w_S | 1.000000 | 1.000000 | 1.000000 | 1.000000 | 1.000000 | 1.00000 |
| 2 | weightedMean(x, w, idxs) | 9.137096 | 7.955688 | 7.958947 | 7.796781 | 7.844646 | 7.62817 |
| 3 | weightedMean(x[idxs], w[idxs]) | 10.078024 | 8.957985 | 9.520899 | 8.703359 | 9.013078 | 10.34469 |
Figure: Benchmarking of weightedMean_x_w_S(), weightedMean(x, w, idxs)() and weightedMean(x[idxs], w[idxs])() on double+n = 1000000 data. Outliers are displayed as crosses. Times are in milliseconds.
Appendix
Session information
R version 4.1.1 Patched (2021-08-10 r80727)
Platform: x86_64-pc-linux-gnu (64-bit)
Running under: Ubuntu 18.04.5 LTS

Matrix products: default
BLAS:   /home/hb/software/R-devel/R-4-1-branch/lib/R/lib/libRblas.so
LAPACK: /home/hb/software/R-devel/R-4-1-branch/lib/R/lib/libRlapack.so

locale:
 [1] LC_CTYPE=en_US.UTF-8       LC_NUMERIC=C
 [3] LC_TIME=en_US.UTF-8        LC_COLLATE=en_US.UTF-8
 [5] LC_MONETARY=en_US.UTF-8    LC_MESSAGES=en_US.UTF-8
 [7] LC_PAPER=en_US.UTF-8       LC_NAME=C
 [9] LC_ADDRESS=C               LC_TELEPHONE=C
[11] LC_MEASUREMENT=en_US.UTF-8 LC_IDENTIFICATION=C

attached base packages:
[1] stats     graphics  grDevices utils     datasets  methods   base

other attached packages:
[1] microbenchmark_1.4-7   matrixStats_0.60.0     ggplot2_3.3.5
[4] knitr_1.33             R.devices_2.17.0       R.utils_2.10.1
[7] R.oo_1.24.0            R.methodsS3_1.8.1-9001 history_0.0.1-9000

loaded via a namespace (and not attached):
 [1] Biobase_2.52.0          httr_1.4.2              splines_4.1.1
 [4] bit64_4.0.5             network_1.17.1          assertthat_0.2.1
 [7] highr_0.9               stats4_4.1.1            blob_1.2.2
[10] GenomeInfoDbData_1.2.6  robustbase_0.93-8       pillar_1.6.2
[13] RSQLite_2.2.8           lattice_0.20-44         glue_1.4.2
[16] digest_0.6.27           XVector_0.32.0          colorspace_2.0-2
[19] Matrix_1.3-4            XML_3.99-0.7            pkgconfig_2.0.3
[22] zlibbioc_1.38.0         genefilter_1.74.0       purrr_0.3.4
[25] ergm_4.1.2              xtable_1.8-4            scales_1.1.1
[28] tibble_3.1.4            annotate_1.70.0         KEGGREST_1.32.0
[31] farver_2.1.0            generics_0.1.0          IRanges_2.26.0
[34] ellipsis_0.3.2          cachem_1.0.6            withr_2.4.2
[37] BiocGenerics_0.38.0     mime_0.11               survival_3.2-13
[40] magrittr_2.0.1          crayon_1.4.1            statnet.common_4.5.0
[43] memoise_2.0.0           laeken_0.5.1            fansi_0.5.0
[46] R.cache_0.15.0          MASS_7.3-54             R.rsp_0.44.0
[49] progressr_0.8.0         tools_4.1.1             lifecycle_1.0.0
[52] S4Vectors_0.30.0        trust_0.1-8             munsell_0.5.0
[55] tabby_0.0.1-9001        AnnotationDbi_1.54.1    Biostrings_2.60.2
[58] compiler_4.1.1          GenomeInfoDb_1.28.1     rlang_0.4.11
[61] grid_4.1.1              RCurl_1.98-1.4          cwhmisc_6.6
[64] rstudioapi_0.13         rappdirs_0.3.3          startup_0.15.0-9000
[67] labeling_0.4.2          bitops_1.0-7            base64enc_0.1-3
[70] boot_1.3-28             gtable_0.3.0            DBI_1.1.1
[73] markdown_1.1            R6_2.5.1                lpSolveAPI_5.5.2.0-17.7
[76] rle_0.9.2               dplyr_1.0.7             fastmap_1.1.0
[79] bit_4.0.4               utf8_1.2.2              parallel_4.1.1
[82] Rcpp_1.0.7              vctrs_0.3.8             png_0.1-7
[85] DEoptimR_1.0-9          tidyselect_1.1.1        xfun_0.25
[88] coda_0.19-4
Total processing time was 15.39 secs.
Reproducibility
To reproduce this report, do:
html <- matrixStats:::benchmark('weightedMean_subset')
Copyright Dongcan Jiang. Last updated on 2021-08-25 22:52:24 (+0200 UTC). Powered by RSP.