matrixStats.benchmarks
varDiff() benchmarks
This report benchmark the performance of varDiff() against alternative methods.
Alternative methods
- N/A
Data type “integer”
Data
> rvector <- function(n, mode = c("logical", "double", "integer"), range = c(-100, +100), na_prob = 0) {
+     mode <- match.arg(mode)
+     if (mode == "logical") {
+         x <- sample(c(FALSE, TRUE), size = n, replace = TRUE)
+     }     else {
+         x <- runif(n, min = range[1], max = range[2])
+     }
+     storage.mode(x) <- mode
+     if (na_prob > 0)
+         x[sample(n, size = na_prob * n)] <- NA
+     x
+ }
> rvectors <- function(scale = 10, seed = 1, ...) {
+     set.seed(seed)
+     data <- list()
+     data[[1]] <- rvector(n = scale * 100, ...)
+     data[[2]] <- rvector(n = scale * 1000, ...)
+     data[[3]] <- rvector(n = scale * 10000, ...)
+     data[[4]] <- rvector(n = scale * 1e+05, ...)
+     data[[5]] <- rvector(n = scale * 1e+06, ...)
+     names(data) <- sprintf("n = %d", sapply(data, FUN = length))
+     data
+ }
> data <- rvectors(mode = mode)
> data <- data[1:4]
Results
n = 1000 vector
All elements
> x <- data[["n = 1000"]]
> stats <- microbenchmark(varDiff = varDiff(x), var = var(x), diff = diff(x), unit = "ms")
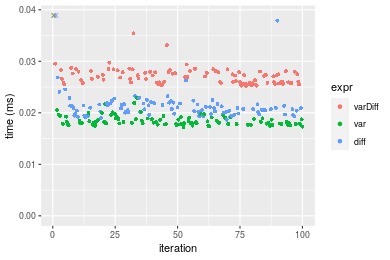
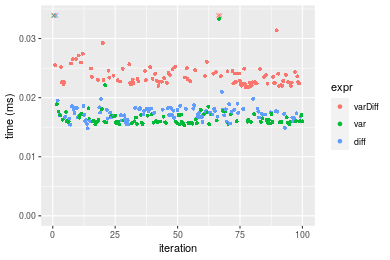
Table: Benchmarking of varDiff(), var() and diff() on integer+n = 1000 data. The top panel shows times in milliseconds and the bottom panel shows relative times.
| expr | min | lq | mean | median | uq | max | |
|---|---|---|---|---|---|---|---|
| 2 | var | 0.017263 | 0.0178385 | 0.0188864 | 0.0182005 | 0.0189145 | 0.059060 |
| 3 | diff | 0.018631 | 0.0198580 | 0.0213724 | 0.0207305 | 0.0216830 | 0.048038 |
| 1 | varDiff | 0.025264 | 0.0258230 | 0.0272910 | 0.0269710 | 0.0279700 | 0.050698 |
| expr | min | lq | mean | median | uq | max | |
|---|---|---|---|---|---|---|---|
| 2 | var | 1.000000 | 1.000000 | 1.000000 | 1.000000 | 1.000000 | 1.0000000 |
| 3 | diff | 1.079245 | 1.113210 | 1.131626 | 1.139007 | 1.146369 | 0.8133762 |
| 1 | varDiff | 1.463477 | 1.447599 | 1.445007 | 1.481882 | 1.478760 | 0.8584152 |
Figure: Benchmarking of varDiff(), var() and diff() on integer+n = 1000 data. Outliers are displayed as crosses. Times are in milliseconds.
n = 10000 vector
All elements
> x <- data[["n = 10000"]]
> stats <- microbenchmark(varDiff = varDiff(x), var = var(x), diff = diff(x), unit = "ms")
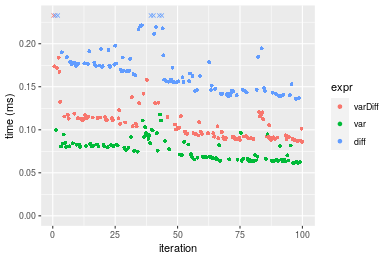
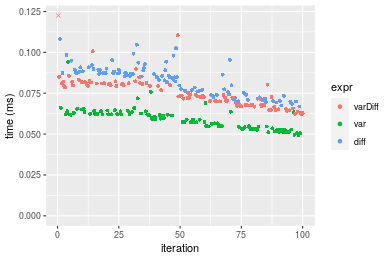
Table: Benchmarking of varDiff(), var() and diff() on integer+n = 10000 data. The top panel shows times in milliseconds and the bottom panel shows relative times.
| expr | min | lq | mean | median | uq | max | |
|---|---|---|---|---|---|---|---|
| 2 | var | 0.061549 | 0.0658010 | 0.0772253 | 0.0771285 | 0.0829330 | 0.117829 |
| 1 | varDiff | 0.086036 | 0.0914765 | 0.1084281 | 0.1030400 | 0.1145355 | 0.270556 |
| 3 | diff | 0.136121 | 0.1465270 | 0.1715013 | 0.1679355 | 0.1787390 | 0.288329 |
| expr | min | lq | mean | median | uq | max | |
|---|---|---|---|---|---|---|---|
| 2 | var | 1.000000 | 1.000000 | 1.000000 | 1.000000 | 1.000000 | 1.000000 |
| 1 | varDiff | 1.397846 | 1.390199 | 1.404049 | 1.335952 | 1.381061 | 2.296175 |
| 3 | diff | 2.211587 | 2.226820 | 2.220791 | 2.177347 | 2.155222 | 2.447012 |
Figure: Benchmarking of varDiff(), var() and diff() on integer+n = 10000 data. Outliers are displayed as crosses. Times are in milliseconds.
n = 100000 vector
All elements
> x <- data[["n = 100000"]]
> stats <- microbenchmark(varDiff = varDiff(x), var = var(x), diff = diff(x), unit = "ms")
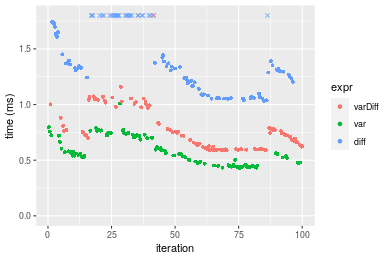
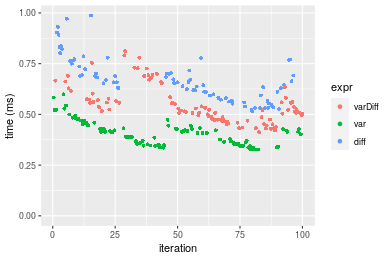
Table: Benchmarking of varDiff(), var() and diff() on integer+n = 100000 data. The top panel shows times in milliseconds and the bottom panel shows relative times.
| expr | min | lq | mean | median | uq | max | |
|---|---|---|---|---|---|---|---|
| 2 | var | 0.431308 | 0.462691 | 0.5831113 | 0.5545305 | 0.713080 | 1.008892 |
| 1 | varDiff | 0.586627 | 0.604608 | 0.8273098 | 0.7255340 | 0.858775 | 7.446869 |
| 3 | diff | 1.033404 | 1.195533 | 1.5823960 | 1.3441620 | 2.049228 | 7.357465 |
| expr | min | lq | mean | median | uq | max | |
|---|---|---|---|---|---|---|---|
| 2 | var | 1.000000 | 1.000000 | 1.000000 | 1.000000 | 1.000000 | 1.000000 |
| 1 | varDiff | 1.360112 | 1.306721 | 1.418785 | 1.308375 | 1.204318 | 7.381235 |
| 3 | diff | 2.395977 | 2.583868 | 2.713712 | 2.423964 | 2.873769 | 7.292619 |
Figure: Benchmarking of varDiff(), var() and diff() on integer+n = 100000 data. Outliers are displayed as crosses. Times are in milliseconds.
n = 1000000 vector
All elements
> x <- data[["n = 1000000"]]
> stats <- microbenchmark(varDiff = varDiff(x), var = var(x), diff = diff(x), unit = "ms")
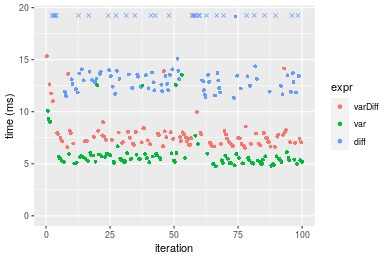
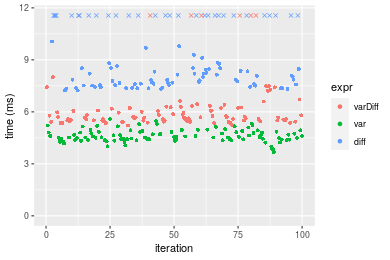
Table: Benchmarking of varDiff(), var() and diff() on integer+n = 1000000 data. The top panel shows times in milliseconds and the bottom panel shows relative times.
| expr | min | lq | mean | median | uq | max | |
|---|---|---|---|---|---|---|---|
| 2 | var | 4.750307 | 5.166704 | 5.893678 | 5.490694 | 5.815732 | 13.54519 |
| 1 | varDiff | 6.524512 | 6.974064 | 8.068979 | 7.444474 | 7.972615 | 30.54505 |
| 3 | diff | 11.344527 | 12.450922 | 15.369838 | 13.484686 | 19.657373 | 25.57203 |
| expr | min | lq | mean | median | uq | max | |
|---|---|---|---|---|---|---|---|
| 2 | var | 1.000000 | 1.000000 | 1.000000 | 1.000000 | 1.000000 | 1.000000 |
| 1 | varDiff | 1.373493 | 1.349809 | 1.369091 | 1.355835 | 1.370871 | 2.255048 |
| 3 | diff | 2.388167 | 2.409839 | 2.607852 | 2.455916 | 3.380034 | 1.887905 |
Figure: Benchmarking of varDiff(), var() and diff() on integer+n = 1000000 data. Outliers are displayed as crosses. Times are in milliseconds.
Data type “double”
Data
> rvector <- function(n, mode = c("logical", "double", "integer"), range = c(-100, +100), na_prob = 0) {
+     mode <- match.arg(mode)
+     if (mode == "logical") {
+         x <- sample(c(FALSE, TRUE), size = n, replace = TRUE)
+     }     else {
+         x <- runif(n, min = range[1], max = range[2])
+     }
+     storage.mode(x) <- mode
+     if (na_prob > 0)
+         x[sample(n, size = na_prob * n)] <- NA
+     x
+ }
> rvectors <- function(scale = 10, seed = 1, ...) {
+     set.seed(seed)
+     data <- list()
+     data[[1]] <- rvector(n = scale * 100, ...)
+     data[[2]] <- rvector(n = scale * 1000, ...)
+     data[[3]] <- rvector(n = scale * 10000, ...)
+     data[[4]] <- rvector(n = scale * 1e+05, ...)
+     data[[5]] <- rvector(n = scale * 1e+06, ...)
+     names(data) <- sprintf("n = %d", sapply(data, FUN = length))
+     data
+ }
> data <- rvectors(mode = mode)
> data <- data[1:4]
Results
n = 1000 vector
All elements
> x <- data[["n = 1000"]]
> stats <- microbenchmark(varDiff = varDiff(x), var = var(x), diff = diff(x), unit = "ms")
Table: Benchmarking of varDiff(), var() and diff() on double+n = 1000 data. The top panel shows times in milliseconds and the bottom panel shows relative times.
| expr | min | lq | mean | median | uq | max | |
|---|---|---|---|---|---|---|---|
| 2 | var | 0.015324 | 0.015781 | 0.0169349 | 0.0159940 | 0.017029 | 0.054035 |
| 3 | diff | 0.014798 | 0.016656 | 0.0176397 | 0.0174040 | 0.018085 | 0.046717 |
| 1 | varDiff | 0.021714 | 0.022524 | 0.0241851 | 0.0231655 | 0.024547 | 0.045064 |
| expr | min | lq | mean | median | uq | max | |
|---|---|---|---|---|---|---|---|
| 2 | var | 1.0000000 | 1.000000 | 1.000000 | 1.000000 | 1.000000 | 1.0000000 |
| 3 | diff | 0.9656748 | 1.055446 | 1.041621 | 1.088158 | 1.062012 | 0.8645693 |
| 1 | varDiff | 1.4169930 | 1.427286 | 1.428122 | 1.448387 | 1.441482 | 0.8339780 |
Figure: Benchmarking of varDiff(), var() and diff() on double+n = 1000 data. Outliers are displayed as crosses. Times are in milliseconds.
n = 10000 vector
All elements
> x <- data[["n = 10000"]]
> stats <- microbenchmark(varDiff = varDiff(x), var = var(x), diff = diff(x), unit = "ms")
Table: Benchmarking of varDiff(), var() and diff() on double+n = 10000 data. The top panel shows times in milliseconds and the bottom panel shows relative times.
| expr | min | lq | mean | median | uq | max | |
|---|---|---|---|---|---|---|---|
| 2 | var | 0.049441 | 0.0533505 | 0.0588828 | 0.0590235 | 0.0622830 | 0.094233 |
| 1 | varDiff | 0.062076 | 0.0679135 | 0.0754562 | 0.0729925 | 0.0807265 | 0.167566 |
| 3 | diff | 0.066900 | 0.0747475 | 0.0830154 | 0.0850790 | 0.0883370 | 0.108227 |
| expr | min | lq | mean | median | uq | max | |
|---|---|---|---|---|---|---|---|
| 2 | var | 1.000000 | 1.000000 | 1.000000 | 1.000000 | 1.000000 | 1.000000 |
| 1 | varDiff | 1.255557 | 1.272968 | 1.281465 | 1.236668 | 1.296124 | 1.778209 |
| 3 | diff | 1.353128 | 1.401065 | 1.409842 | 1.441443 | 1.418316 | 1.148504 |
Figure: Benchmarking of varDiff(), var() and diff() on double+n = 10000 data. Outliers are displayed as crosses. Times are in milliseconds.
n = 100000 vector
All elements
> x <- data[["n = 100000"]]
> stats <- microbenchmark(varDiff = varDiff(x), var = var(x), diff = diff(x), unit = "ms")
Table: Benchmarking of varDiff(), var() and diff() on double+n = 100000 data. The top panel shows times in milliseconds and the bottom panel shows relative times.
| expr | min | lq | mean | median | uq | max | |
|---|---|---|---|---|---|---|---|
| 2 | var | 0.326733 | 0.353135 | 0.4040287 | 0.4083090 | 0.4307145 | 0.598747 |
| 1 | varDiff | 0.411866 | 0.474849 | 0.5457040 | 0.5212120 | 0.5764060 | 0.812143 |
| 3 | diff | 0.515145 | 0.615211 | 1.0233537 | 0.6881855 | 0.8975840 | 7.984266 |
| expr | min | lq | mean | median | uq | max | |
|---|---|---|---|---|---|---|---|
| 2 | var | 1.000000 | 1.000000 | 1.000000 | 1.000000 | 1.000000 | 1.000000 |
| 1 | varDiff | 1.260558 | 1.344667 | 1.350656 | 1.276514 | 1.338255 | 1.356404 |
| 3 | diff | 1.576654 | 1.742141 | 2.532874 | 1.685453 | 2.083942 | 13.334958 |
Figure: Benchmarking of varDiff(), var() and diff() on double+n = 100000 data. Outliers are displayed as crosses. Times are in milliseconds.
n = 1000000 vector
All elements
> x <- data[["n = 1000000"]]
> stats <- microbenchmark(varDiff = varDiff(x), var = var(x), diff = diff(x), unit = "ms")
Table: Benchmarking of varDiff(), var() and diff() on double+n = 1000000 data. The top panel shows times in milliseconds and the bottom panel shows relative times.
| expr | min | lq | mean | median | uq | max | |
|---|---|---|---|---|---|---|---|
| 2 | var | 3.667983 | 4.397274 | 4.62480 | 4.560160 | 4.844445 | 5.584471 |
| 1 | varDiff | 5.217178 | 5.504392 | 6.41692 | 5.689897 | 6.244734 | 21.075055 |
| 3 | diff | 7.226720 | 7.597451 | 10.51134 | 8.235660 | 14.475874 | 21.908809 |
| expr | min | lq | mean | median | uq | max | |
|---|---|---|---|---|---|---|---|
| 2 | var | 1.000000 | 1.000000 | 1.000000 | 1.000000 | 1.000000 | 1.000000 |
| 1 | varDiff | 1.422356 | 1.251774 | 1.387502 | 1.247741 | 1.289050 | 3.773868 |
| 3 | diff | 1.970216 | 1.727764 | 2.272821 | 1.806002 | 2.988138 | 3.923166 |
Figure: Benchmarking of varDiff(), var() and diff() on double+n = 1000000 data. Outliers are displayed as crosses. Times are in milliseconds.
Appendix
Session information
R version 4.1.1 Patched (2021-08-10 r80727)
Platform: x86_64-pc-linux-gnu (64-bit)
Running under: Ubuntu 18.04.5 LTS

Matrix products: default
BLAS:   /home/hb/software/R-devel/R-4-1-branch/lib/R/lib/libRblas.so
LAPACK: /home/hb/software/R-devel/R-4-1-branch/lib/R/lib/libRlapack.so

locale:
 [1] LC_CTYPE=en_US.UTF-8       LC_NUMERIC=C
 [3] LC_TIME=en_US.UTF-8        LC_COLLATE=en_US.UTF-8
 [5] LC_MONETARY=en_US.UTF-8    LC_MESSAGES=en_US.UTF-8
 [7] LC_PAPER=en_US.UTF-8       LC_NAME=C
 [9] LC_ADDRESS=C               LC_TELEPHONE=C
[11] LC_MEASUREMENT=en_US.UTF-8 LC_IDENTIFICATION=C

attached base packages:
[1] stats     graphics  grDevices utils     datasets  methods   base

other attached packages:
[1] microbenchmark_1.4-7   matrixStats_0.60.0     ggplot2_3.3.5
[4] knitr_1.33             R.devices_2.17.0       R.utils_2.10.1
[7] R.oo_1.24.0            R.methodsS3_1.8.1-9001 history_0.0.1-9000

loaded via a namespace (and not attached):
 [1] Biobase_2.52.0          httr_1.4.2              splines_4.1.1
 [4] bit64_4.0.5             network_1.17.1          assertthat_0.2.1
 [7] highr_0.9               stats4_4.1.1            blob_1.2.2
[10] GenomeInfoDbData_1.2.6  robustbase_0.93-8       pillar_1.6.2
[13] RSQLite_2.2.8           lattice_0.20-44         glue_1.4.2
[16] digest_0.6.27           XVector_0.32.0          colorspace_2.0-2
[19] Matrix_1.3-4            XML_3.99-0.7            pkgconfig_2.0.3
[22] zlibbioc_1.38.0         genefilter_1.74.0       purrr_0.3.4
[25] ergm_4.1.2              xtable_1.8-4            scales_1.1.1
[28] tibble_3.1.4            annotate_1.70.0         KEGGREST_1.32.0
[31] farver_2.1.0            generics_0.1.0          IRanges_2.26.0
[34] ellipsis_0.3.2          cachem_1.0.6            withr_2.4.2
[37] BiocGenerics_0.38.0     mime_0.11               survival_3.2-13
[40] magrittr_2.0.1          crayon_1.4.1            statnet.common_4.5.0
[43] memoise_2.0.0           laeken_0.5.1            fansi_0.5.0
[46] R.cache_0.15.0          MASS_7.3-54             R.rsp_0.44.0
[49] progressr_0.8.0         tools_4.1.1             lifecycle_1.0.0
[52] S4Vectors_0.30.0        trust_0.1-8             munsell_0.5.0
[55] tabby_0.0.1-9001        AnnotationDbi_1.54.1    Biostrings_2.60.2
[58] compiler_4.1.1          GenomeInfoDb_1.28.1     rlang_0.4.11
[61] grid_4.1.1              RCurl_1.98-1.4          cwhmisc_6.6
[64] rstudioapi_0.13         rappdirs_0.3.3          startup_0.15.0-9000
[67] labeling_0.4.2          bitops_1.0-7            base64enc_0.1-3
[70] boot_1.3-28             gtable_0.3.0            DBI_1.1.1
[73] markdown_1.1            R6_2.5.1                lpSolveAPI_5.5.2.0-17.7
[76] rle_0.9.2               dplyr_1.0.7             fastmap_1.1.0
[79] bit_4.0.4               utf8_1.2.2              parallel_4.1.1
[82] Rcpp_1.0.7              vctrs_0.3.8             png_0.1-7
[85] DEoptimR_1.0-9          tidyselect_1.1.1        xfun_0.25
[88] coda_0.19-4
Total processing time was 14.04 secs.
Reproducibility
To reproduce this report, do:
html <- matrixStats:::benchmark('varDiff')
Copyright Henrik Bengtsson. Last updated on 2021-08-25 22:52:08 (+0200 UTC). Powered by RSP.