matrixStats.benchmarks
madDiff() benchmarks on subsetted computation
This report benchmark the performance of madDiff() on subsetted computation.
Data type “integer”
Data
> rvector <- function(n, mode = c("logical", "double", "integer"), range = c(-100, +100), na_prob = 0) {
+     mode <- match.arg(mode)
+     if (mode == "logical") {
+         x <- sample(c(FALSE, TRUE), size = n, replace = TRUE)
+     }     else {
+         x <- runif(n, min = range[1], max = range[2])
+     }
+     storage.mode(x) <- mode
+     if (na_prob > 0)
+         x[sample(n, size = na_prob * n)] <- NA
+     x
+ }
> rvectors <- function(scale = 10, seed = 1, ...) {
+     set.seed(seed)
+     data <- list()
+     data[[1]] <- rvector(n = scale * 100, ...)
+     data[[2]] <- rvector(n = scale * 1000, ...)
+     data[[3]] <- rvector(n = scale * 10000, ...)
+     data[[4]] <- rvector(n = scale * 1e+05, ...)
+     data[[5]] <- rvector(n = scale * 1e+06, ...)
+     names(data) <- sprintf("n = %d", sapply(data, FUN = length))
+     data
+ }
> data <- rvectors(mode = mode)
Results
n = 1000 vector
> x <- data[["n = 1000"]]
> idxs <- sample.int(length(x), size = length(x) * 0.7)
> x_S <- x[idxs]
> gc()
           used  (Mb) gc trigger  (Mb) max used  (Mb)
Ncells  5344253 285.5    7916910 422.9  7916910 422.9
Vcells 17011428 129.8   36893127 281.5 57430649 438.2
> stats <- microbenchmark(madDiff_x_S = madDiff(x_S), `madDiff(x, idxs)` = madDiff(x, idxs = idxs),
+     `madDiff(x[idxs])` = madDiff(x[idxs]), unit = "ms")
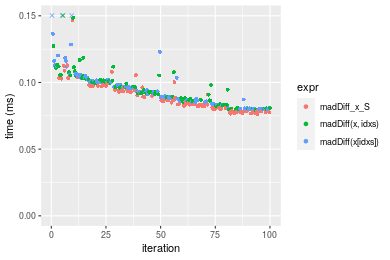
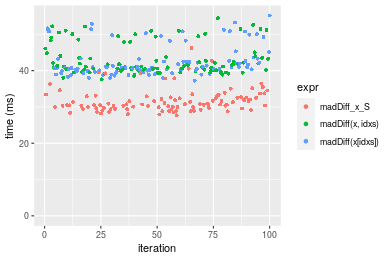
Table: Benchmarking of madDiff_x_S(), madDiff(x, idxs)() and madDiff(x[idxs])() on integer+n = 1000 data. The top panel shows times in milliseconds and the bottom panel shows relative times.
| expr | min | lq | mean | median | uq | max | |
|---|---|---|---|---|---|---|---|
| 1 | madDiff_x_S | 0.076442 | 0.0799290 | 0.0881440 | 0.084452 | 0.0942640 | 0.146663 |
| 2 | madDiff(x, idxs) | 0.079360 | 0.0860325 | 0.0954273 | 0.092769 | 0.1014305 | 0.166170 |
| 3 | madDiff(x[idxs]) | 0.079384 | 0.0846570 | 0.1001273 | 0.092774 | 0.1021840 | 0.528362 |
| expr | min | lq | mean | median | uq | max | |
|---|---|---|---|---|---|---|---|
| 1 | madDiff_x_S | 1.000000 | 1.000000 | 1.000000 | 1.000000 | 1.000000 | 1.000000 |
| 2 | madDiff(x, idxs) | 1.038173 | 1.076361 | 1.082629 | 1.098482 | 1.076026 | 1.133006 |
| 3 | madDiff(x[idxs]) | 1.038487 | 1.059152 | 1.135951 | 1.098541 | 1.084019 | 3.602558 |
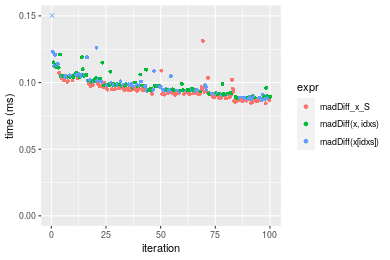
Figure: Benchmarking of madDiff_x_S(), madDiff(x, idxs)() and madDiff(x[idxs])() on integer+n = 1000 data. Outliers are displayed as crosses. Times are in milliseconds.
n = 10000 vector
> x <- data[["n = 10000"]]
> idxs <- sample.int(length(x), size = length(x) * 0.7)
> x_S <- x[idxs]
> gc()
           used  (Mb) gc trigger  (Mb) max used  (Mb)
Ncells  5341851 285.3    7916910 422.9  7916910 422.9
Vcells 15882129 121.2   36893127 281.5 57430649 438.2
> stats <- microbenchmark(madDiff_x_S = madDiff(x_S), `madDiff(x, idxs)` = madDiff(x, idxs = idxs),
+     `madDiff(x[idxs])` = madDiff(x[idxs]), unit = "ms")
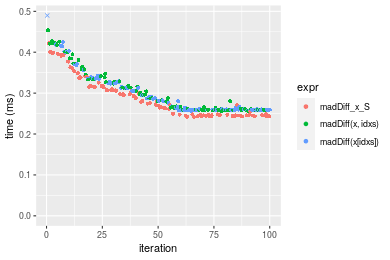
Table: Benchmarking of madDiff_x_S(), madDiff(x, idxs)() and madDiff(x[idxs])() on integer+n = 10000 data. The top panel shows times in milliseconds and the bottom panel shows relative times.
| expr | min | lq | mean | median | uq | max | |
|---|---|---|---|---|---|---|---|
| 1 | madDiff_x_S | 0.241986 | 0.2458525 | 0.2896286 | 0.2729940 | 0.3160605 | 0.421982 |
| 3 | madDiff(x[idxs]) | 0.255741 | 0.2593270 | 0.2991417 | 0.2801310 | 0.3266175 | 0.555078 |
| 2 | madDiff(x, idxs) | 0.256148 | 0.2596000 | 0.3065501 | 0.2874185 | 0.3367050 | 0.453426 |
| expr | min | lq | mean | median | uq | max | |
|---|---|---|---|---|---|---|---|
| 1 | madDiff_x_S | 1.000000 | 1.000000 | 1.000000 | 1.000000 | 1.000000 | 1.000000 |
| 3 | madDiff(x[idxs]) | 1.056842 | 1.054807 | 1.032846 | 1.026143 | 1.033402 | 1.315407 |
| 2 | madDiff(x, idxs) | 1.058524 | 1.055918 | 1.058425 | 1.052838 | 1.065318 | 1.074515 |
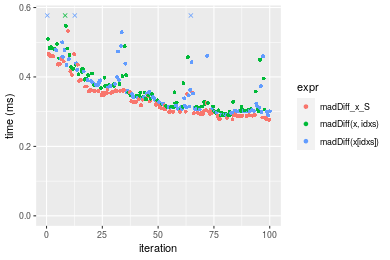
Figure: Benchmarking of madDiff_x_S(), madDiff(x, idxs)() and madDiff(x[idxs])() on integer+n = 10000 data. Outliers are displayed as crosses. Times are in milliseconds.
n = 100000 vector
> x <- data[["n = 100000"]]
> idxs <- sample.int(length(x), size = length(x) * 0.7)
> x_S <- x[idxs]
> gc()
           used  (Mb) gc trigger  (Mb) max used  (Mb)
Ncells  5341923 285.3    7916910 422.9  7916910 422.9
Vcells 15945689 121.7   36893127 281.5 57430649 438.2
> stats <- microbenchmark(madDiff_x_S = madDiff(x_S), `madDiff(x, idxs)` = madDiff(x, idxs = idxs),
+     `madDiff(x[idxs])` = madDiff(x[idxs]), unit = "ms")
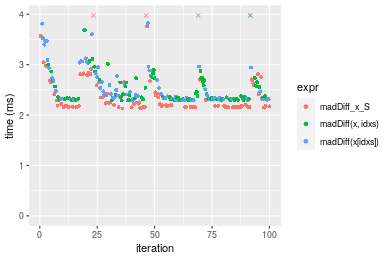
Table: Benchmarking of madDiff_x_S(), madDiff(x, idxs)() and madDiff(x[idxs])() on integer+n = 100000 data. The top panel shows times in milliseconds and the bottom panel shows relative times.
| expr | min | lq | mean | median | uq | max | |
|---|---|---|---|---|---|---|---|
| 1 | madDiff_x_S | 2.129314 | 2.160170 | 2.517114 | 2.199688 | 2.609695 | 9.828779 |
| 2 | madDiff(x, idxs) | 2.286819 | 2.313893 | 2.534705 | 2.338712 | 2.615870 | 8.736546 |
| 3 | madDiff(x[idxs]) | 2.284914 | 2.316596 | 2.636846 | 2.380107 | 2.775296 | 8.292508 |
| expr | min | lq | mean | median | uq | max | |
|---|---|---|---|---|---|---|---|
| 1 | madDiff_x_S | 1.000000 | 1.000000 | 1.000000 | 1.000000 | 1.000000 | 1.0000000 |
| 2 | madDiff(x, idxs) | 1.073970 | 1.071162 | 1.006988 | 1.063202 | 1.002366 | 0.8888740 |
| 3 | madDiff(x[idxs]) | 1.073075 | 1.072413 | 1.047567 | 1.082021 | 1.063456 | 0.8436967 |
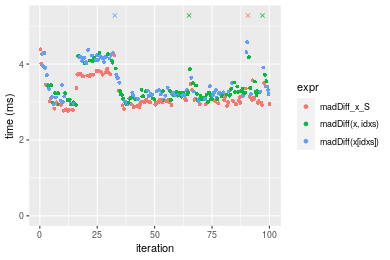
Figure: Benchmarking of madDiff_x_S(), madDiff(x, idxs)() and madDiff(x[idxs])() on integer+n = 100000 data. Outliers are displayed as crosses. Times are in milliseconds.
n = 1000000 vector
> x <- data[["n = 1000000"]]
> idxs <- sample.int(length(x), size = length(x) * 0.7)
> x_S <- x[idxs]
> gc()
           used  (Mb) gc trigger  (Mb) max used  (Mb)
Ncells  5341995 285.3    7916910 422.9  7916910 422.9
Vcells 16575738 126.5   36893127 281.5 57430649 438.2
> stats <- microbenchmark(madDiff_x_S = madDiff(x_S), `madDiff(x, idxs)` = madDiff(x, idxs = idxs),
+     `madDiff(x[idxs])` = madDiff(x[idxs]), unit = "ms")
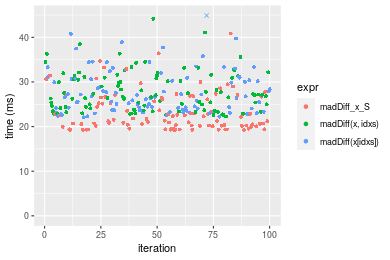
Table: Benchmarking of madDiff_x_S(), madDiff(x, idxs)() and madDiff(x[idxs])() on integer+n = 1000000 data. The top panel shows times in milliseconds and the bottom panel shows relative times.
| expr | min | lq | mean | median | uq | max | |
|---|---|---|---|---|---|---|---|
| 1 | madDiff_x_S | 19.21814 | 20.16101 | 23.29995 | 21.41715 | 26.30154 | 40.84189 |
| 3 | madDiff(x[idxs]) | 22.07896 | 23.91887 | 31.53210 | 26.59459 | 30.84588 | 417.09725 |
| 2 | madDiff(x, idxs) | 22.23748 | 23.95018 | 27.84580 | 26.91693 | 31.03340 | 44.13918 |
| expr | min | lq | mean | median | uq | max | |
|---|---|---|---|---|---|---|---|
| 1 | madDiff_x_S | 1.000000 | 1.000000 | 1.000000 | 1.000000 | 1.000000 | 1.000000 |
| 3 | madDiff(x[idxs]) | 1.148860 | 1.186392 | 1.353312 | 1.241743 | 1.172778 | 10.212487 |
| 2 | madDiff(x, idxs) | 1.157109 | 1.187945 | 1.195101 | 1.256793 | 1.179908 | 1.080733 |
Figure: Benchmarking of madDiff_x_S(), madDiff(x, idxs)() and madDiff(x[idxs])() on integer+n = 1000000 data. Outliers are displayed as crosses. Times are in milliseconds.
n = 10000000 vector
> x <- data[["n = 10000000"]]
> idxs <- sample.int(length(x), size = length(x) * 0.7)
> x_S <- x[idxs]
> gc()
           used  (Mb) gc trigger  (Mb) max used  (Mb)
Ncells  5342067 285.3    7916910 422.9  7916910 422.9
Vcells 22875786 174.6   36893127 281.5 57430649 438.2
> stats <- microbenchmark(madDiff_x_S = madDiff(x_S), `madDiff(x, idxs)` = madDiff(x, idxs = idxs),
+     `madDiff(x[idxs])` = madDiff(x[idxs]), unit = "ms")
Table: Benchmarking of madDiff_x_S(), madDiff(x, idxs)() and madDiff(x[idxs])() on integer+n = 10000000 data. The top panel shows times in milliseconds and the bottom panel shows relative times.
| expr | min | lq | mean | median | uq | max | |
|---|---|---|---|---|---|---|---|
| 1 | madDiff_x_S | 223.9843 | 235.0427 | 281.9048 | 241.0282 | 255.6912 | 658.2526 |
| 2 | madDiff(x, idxs) | 346.1576 | 371.1629 | 416.0227 | 383.7330 | 400.6054 | 805.2715 |
| 3 | madDiff(x[idxs]) | 356.6291 | 382.9311 | 461.8421 | 394.5892 | 420.1714 | 818.3962 |
| expr | min | lq | mean | median | uq | max | |
|---|---|---|---|---|---|---|---|
| 1 | madDiff_x_S | 1.000000 | 1.000000 | 1.000000 | 1.000000 | 1.000000 | 1.000000 |
| 2 | madDiff(x, idxs) | 1.545455 | 1.579130 | 1.475756 | 1.592067 | 1.566755 | 1.223347 |
| 3 | madDiff(x[idxs]) | 1.592206 | 1.629198 | 1.638291 | 1.637108 | 1.643277 | 1.243286 |
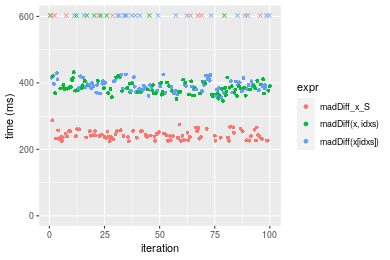
Figure: Benchmarking of madDiff_x_S(), madDiff(x, idxs)() and madDiff(x[idxs])() on integer+n = 10000000 data. Outliers are displayed as crosses. Times are in milliseconds.
Data type “double”
Data
> rvector <- function(n, mode = c("logical", "double", "integer"), range = c(-100, +100), na_prob = 0) {
+     mode <- match.arg(mode)
+     if (mode == "logical") {
+         x <- sample(c(FALSE, TRUE), size = n, replace = TRUE)
+     }     else {
+         x <- runif(n, min = range[1], max = range[2])
+     }
+     storage.mode(x) <- mode
+     if (na_prob > 0)
+         x[sample(n, size = na_prob * n)] <- NA
+     x
+ }
> rvectors <- function(scale = 10, seed = 1, ...) {
+     set.seed(seed)
+     data <- list()
+     data[[1]] <- rvector(n = scale * 100, ...)
+     data[[2]] <- rvector(n = scale * 1000, ...)
+     data[[3]] <- rvector(n = scale * 10000, ...)
+     data[[4]] <- rvector(n = scale * 1e+05, ...)
+     data[[5]] <- rvector(n = scale * 1e+06, ...)
+     names(data) <- sprintf("n = %d", sapply(data, FUN = length))
+     data
+ }
> data <- rvectors(mode = mode)
Results
n = 1000 vector
> x <- data[["n = 1000"]]
> idxs <- sample.int(length(x), size = length(x) * 0.7)
> x_S <- x[idxs]
> gc()
           used  (Mb) gc trigger  (Mb) max used  (Mb)
Ncells  5342148 285.4    7916910 422.9  7916910 422.9
Vcells 21432997 163.6   66913630 510.6 65932233 503.1
> stats <- microbenchmark(madDiff_x_S = madDiff(x_S), `madDiff(x, idxs)` = madDiff(x, idxs = idxs),
+     `madDiff(x[idxs])` = madDiff(x[idxs]), unit = "ms")
Table: Benchmarking of madDiff_x_S(), madDiff(x, idxs)() and madDiff(x[idxs])() on double+n = 1000 data. The top panel shows times in milliseconds and the bottom panel shows relative times.
| expr | min | lq | mean | median | uq | max | |
|---|---|---|---|---|---|---|---|
| 1 | madDiff_x_S | 0.084334 | 0.089016 | 0.0934545 | 0.0923530 | 0.0964715 | 0.131338 |
| 3 | madDiff(x[idxs]) | 0.087137 | 0.091671 | 0.0992167 | 0.0970800 | 0.1033340 | 0.227260 |
| 2 | madDiff(x, idxs) | 0.088080 | 0.093526 | 0.0981428 | 0.0974065 | 0.1023410 | 0.121016 |
| expr | min | lq | mean | median | uq | max | |
|---|---|---|---|---|---|---|---|
| 1 | madDiff_x_S | 1.000000 | 1.000000 | 1.000000 | 1.000000 | 1.000000 | 1.0000000 |
| 3 | madDiff(x[idxs]) | 1.033237 | 1.029826 | 1.061659 | 1.051184 | 1.071135 | 1.7303446 |
| 2 | madDiff(x, idxs) | 1.044419 | 1.050665 | 1.050167 | 1.054719 | 1.060842 | 0.9214089 |
Figure: Benchmarking of madDiff_x_S(), madDiff(x, idxs)() and madDiff(x[idxs])() on double+n = 1000 data. Outliers are displayed as crosses. Times are in milliseconds.
n = 10000 vector
> x <- data[["n = 10000"]]
> idxs <- sample.int(length(x), size = length(x) * 0.7)
> x_S <- x[idxs]
> gc()
           used  (Mb) gc trigger  (Mb) max used  (Mb)
Ncells  5342211 285.4    7916910 422.9  7916910 422.9
Vcells 21442479 163.6   66913630 510.6 65932233 503.1
> stats <- microbenchmark(madDiff_x_S = madDiff(x_S), `madDiff(x, idxs)` = madDiff(x, idxs = idxs),
+     `madDiff(x[idxs])` = madDiff(x[idxs]), unit = "ms")
Table: Benchmarking of madDiff_x_S(), madDiff(x, idxs)() and madDiff(x[idxs])() on double+n = 10000 data. The top panel shows times in milliseconds and the bottom panel shows relative times.
| expr | min | lq | mean | median | uq | max | |
|---|---|---|---|---|---|---|---|
| 1 | madDiff_x_S | 0.276932 | 0.2947845 | 0.3392882 | 0.3269570 | 0.3602870 | 0.532405 |
| 3 | madDiff(x[idxs]) | 0.289242 | 0.3073325 | 0.3624250 | 0.3411220 | 0.3887430 | 0.615523 |
| 2 | madDiff(x, idxs) | 0.289653 | 0.3109800 | 0.3649975 | 0.3464645 | 0.4050515 | 0.652488 |
| expr | min | lq | mean | median | uq | max | |
|---|---|---|---|---|---|---|---|
| 1 | madDiff_x_S | 1.000000 | 1.000000 | 1.000000 | 1.000000 | 1.000000 | 1.000000 |
| 3 | madDiff(x[idxs]) | 1.044451 | 1.042567 | 1.068192 | 1.043324 | 1.078982 | 1.156118 |
| 2 | madDiff(x, idxs) | 1.045935 | 1.054940 | 1.075774 | 1.059664 | 1.124247 | 1.225548 |
Figure: Benchmarking of madDiff_x_S(), madDiff(x, idxs)() and madDiff(x[idxs])() on double+n = 10000 data. Outliers are displayed as crosses. Times are in milliseconds.
n = 100000 vector
> x <- data[["n = 100000"]]
> idxs <- sample.int(length(x), size = length(x) * 0.7)
> x_S <- x[idxs]
> gc()
           used  (Mb) gc trigger  (Mb) max used  (Mb)
Ncells  5342283 285.4    7916910 422.9  7916910 422.9
Vcells 21537360 164.4   66913630 510.6 65932233 503.1
> stats <- microbenchmark(madDiff_x_S = madDiff(x_S), `madDiff(x, idxs)` = madDiff(x, idxs = idxs),
+     `madDiff(x[idxs])` = madDiff(x[idxs]), unit = "ms")
Table: Benchmarking of madDiff_x_S(), madDiff(x, idxs)() and madDiff(x[idxs])() on double+n = 100000 data. The top panel shows times in milliseconds and the bottom panel shows relative times.
| expr | min | lq | mean | median | uq | max | |
|---|---|---|---|---|---|---|---|
| 1 | madDiff_x_S | 2.769695 | 2.946010 | 3.229999 | 3.038127 | 3.485053 | 5.296025 |
| 2 | madDiff(x, idxs) | 2.929154 | 3.088465 | 3.437747 | 3.206155 | 3.358687 | 9.822420 |
| 3 | madDiff(x[idxs]) | 2.930527 | 3.164171 | 3.544953 | 3.267368 | 3.988570 | 10.072499 |
| expr | min | lq | mean | median | uq | max | |
|---|---|---|---|---|---|---|---|
| 1 | madDiff_x_S | 1.000000 | 1.000000 | 1.000000 | 1.000000 | 1.0000000 | 1.000000 |
| 2 | madDiff(x, idxs) | 1.057573 | 1.048355 | 1.064318 | 1.055307 | 0.9637404 | 1.854678 |
| 3 | madDiff(x[idxs]) | 1.058069 | 1.074053 | 1.097509 | 1.075455 | 1.1444787 | 1.901898 |
Figure: Benchmarking of madDiff_x_S(), madDiff(x, idxs)() and madDiff(x[idxs])() on double+n = 100000 data. Outliers are displayed as crosses. Times are in milliseconds.
n = 1000000 vector
> x <- data[["n = 1000000"]]
> idxs <- sample.int(length(x), size = length(x) * 0.7)
> x_S <- x[idxs]
> gc()
           used  (Mb) gc trigger  (Mb) max used  (Mb)
Ncells  5342355 285.4    7916910 422.9  7916910 422.9
Vcells 22482804 171.6   66913630 510.6 66909510 510.5
> stats <- microbenchmark(madDiff_x_S = madDiff(x_S), `madDiff(x, idxs)` = madDiff(x, idxs = idxs),
+     `madDiff(x[idxs])` = madDiff(x[idxs]), unit = "ms")
Table: Benchmarking of madDiff_x_S(), madDiff(x, idxs)() and madDiff(x[idxs])() on double+n = 1000000 data. The top panel shows times in milliseconds and the bottom panel shows relative times.
| expr | min | lq | mean | median | uq | max | |
|---|---|---|---|---|---|---|---|
| 1 | madDiff_x_S | 27.67178 | 29.77384 | 31.77019 | 30.72146 | 32.80154 | 46.24240 |
| 3 | madDiff(x[idxs]) | 37.20858 | 39.89259 | 42.56868 | 40.85085 | 43.18691 | 55.18924 |
| 2 | madDiff(x, idxs) | 37.59856 | 40.26422 | 43.08320 | 41.20645 | 44.43903 | 54.45280 |
| expr | min | lq | mean | median | uq | max | |
|---|---|---|---|---|---|---|---|
| 1 | madDiff_x_S | 1.000000 | 1.000000 | 1.000000 | 1.000000 | 1.000000 | 1.000000 |
| 3 | madDiff(x[idxs]) | 1.344640 | 1.339854 | 1.339894 | 1.329717 | 1.316612 | 1.193477 |
| 2 | madDiff(x, idxs) | 1.358733 | 1.352335 | 1.356089 | 1.341292 | 1.354785 | 1.177551 |
Figure: Benchmarking of madDiff_x_S(), madDiff(x, idxs)() and madDiff(x[idxs])() on double+n = 1000000 data. Outliers are displayed as crosses. Times are in milliseconds.
n = 10000000 vector
> x <- data[["n = 10000000"]]
> idxs <- sample.int(length(x), size = length(x) * 0.7)
> x_S <- x[idxs]
> gc()
           used  (Mb) gc trigger  (Mb) max used  (Mb)
Ncells  5342427 285.4    7916910 422.9  7916910 422.9
Vcells 31932852 243.7   66913630 510.6 66909510 510.5
> stats <- microbenchmark(madDiff_x_S = madDiff(x_S), `madDiff(x, idxs)` = madDiff(x, idxs = idxs),
+     `madDiff(x[idxs])` = madDiff(x[idxs]), unit = "ms")
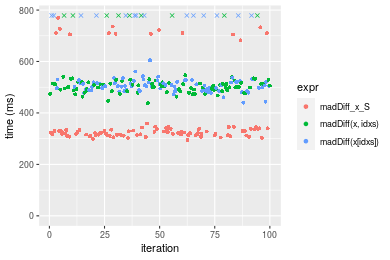
Table: Benchmarking of madDiff_x_S(), madDiff(x, idxs)() and madDiff(x[idxs])() on double+n = 10000000 data. The top panel shows times in milliseconds and the bottom panel shows relative times.
| expr | min | lq | mean | median | uq | max | |
|---|---|---|---|---|---|---|---|
| 1 | madDiff_x_S | 295.2065 | 315.0181 | 378.5460 | 324.6075 | 339.9018 | 770.2836 |
| 2 | madDiff(x, idxs) | 437.4005 | 488.3774 | 536.7878 | 506.2254 | 519.6453 | 920.3717 |
| 3 | madDiff(x[idxs]) | 439.6459 | 493.2539 | 561.7259 | 508.0569 | 529.1599 | 940.5145 |
| expr | min | lq | mean | median | uq | max | |
|---|---|---|---|---|---|---|---|
| 1 | madDiff_x_S | 1.000000 | 1.000000 | 1.000000 | 1.000000 | 1.000000 | 1.000000 |
| 2 | madDiff(x, idxs) | 1.481677 | 1.550315 | 1.418025 | 1.559500 | 1.528810 | 1.194848 |
| 3 | madDiff(x[idxs]) | 1.489283 | 1.565795 | 1.483904 | 1.565142 | 1.556802 | 1.220998 |
Figure: Benchmarking of madDiff_x_S(), madDiff(x, idxs)() and madDiff(x[idxs])() on double+n = 10000000 data. Outliers are displayed as crosses. Times are in milliseconds.
Appendix
Session information
R version 4.1.1 Patched (2021-08-10 r80727)
Platform: x86_64-pc-linux-gnu (64-bit)
Running under: Ubuntu 18.04.5 LTS

Matrix products: default
BLAS:   /home/hb/software/R-devel/R-4-1-branch/lib/R/lib/libRblas.so
LAPACK: /home/hb/software/R-devel/R-4-1-branch/lib/R/lib/libRlapack.so

locale:
 [1] LC_CTYPE=en_US.UTF-8       LC_NUMERIC=C
 [3] LC_TIME=en_US.UTF-8        LC_COLLATE=en_US.UTF-8
 [5] LC_MONETARY=en_US.UTF-8    LC_MESSAGES=en_US.UTF-8
 [7] LC_PAPER=en_US.UTF-8       LC_NAME=C
 [9] LC_ADDRESS=C               LC_TELEPHONE=C
[11] LC_MEASUREMENT=en_US.UTF-8 LC_IDENTIFICATION=C

attached base packages:
[1] stats     graphics  grDevices utils     datasets  methods   base

other attached packages:
[1] microbenchmark_1.4-7   matrixStats_0.60.0     ggplot2_3.3.5
[4] knitr_1.33             R.devices_2.17.0       R.utils_2.10.1
[7] R.oo_1.24.0            R.methodsS3_1.8.1-9001 history_0.0.1-9000

loaded via a namespace (and not attached):
 [1] Biobase_2.52.0          httr_1.4.2              splines_4.1.1
 [4] bit64_4.0.5             network_1.17.1          assertthat_0.2.1
 [7] highr_0.9               stats4_4.1.1            blob_1.2.2
[10] GenomeInfoDbData_1.2.6  robustbase_0.93-8       pillar_1.6.2
[13] RSQLite_2.2.8           lattice_0.20-44         glue_1.4.2
[16] digest_0.6.27           XVector_0.32.0          colorspace_2.0-2
[19] Matrix_1.3-4            XML_3.99-0.7            pkgconfig_2.0.3
[22] zlibbioc_1.38.0         genefilter_1.74.0       purrr_0.3.4
[25] ergm_4.1.2              xtable_1.8-4            scales_1.1.1
[28] tibble_3.1.4            annotate_1.70.0         KEGGREST_1.32.0
[31] farver_2.1.0            generics_0.1.0          IRanges_2.26.0
[34] ellipsis_0.3.2          cachem_1.0.6            withr_2.4.2
[37] BiocGenerics_0.38.0     mime_0.11               survival_3.2-13
[40] magrittr_2.0.1          crayon_1.4.1            statnet.common_4.5.0
[43] memoise_2.0.0           laeken_0.5.1            fansi_0.5.0
[46] R.cache_0.15.0          MASS_7.3-54             R.rsp_0.44.0
[49] progressr_0.8.0         tools_4.1.1             lifecycle_1.0.0
[52] S4Vectors_0.30.0        trust_0.1-8             munsell_0.5.0
[55] tabby_0.0.1-9001        AnnotationDbi_1.54.1    Biostrings_2.60.2
[58] compiler_4.1.1          GenomeInfoDb_1.28.1     rlang_0.4.11
[61] grid_4.1.1              RCurl_1.98-1.4          cwhmisc_6.6
[64] rstudioapi_0.13         rappdirs_0.3.3          startup_0.15.0-9000
[67] labeling_0.4.2          bitops_1.0-7            base64enc_0.1-3
[70] boot_1.3-28             gtable_0.3.0            DBI_1.1.1
[73] markdown_1.1            R6_2.5.1                lpSolveAPI_5.5.2.0-17.7
[76] rle_0.9.2               dplyr_1.0.7             fastmap_1.1.0
[79] bit_4.0.4               utf8_1.2.2              parallel_4.1.1
[82] Rcpp_1.0.7              vctrs_0.3.8             png_0.1-7
[85] DEoptimR_1.0-9          tidyselect_1.1.1        xfun_0.25
[88] coda_0.19-4
Total processing time was 4.98 mins.
Reproducibility
To reproduce this report, do:
html <- matrixStats:::benchmark('madDiff_subset')
Copyright Dongcan Jiang. Last updated on 2021-08-25 22:40:28 (+0200 UTC). Powered by RSP.