matrixStats.benchmarks
logSumExp() benchmarks
This report benchmark the performance of logSumExp() against alternative methods.
Alternative methods
- logSumExp_R()
where
> logSumExp_R <- function(lx, ...) {
+     iMax <- which.max(lx)
+     log1p(sum(exp(lx[-iMax] - lx[iMax]))) + lx[iMax]
+ }
Data
> rvector <- function(n, mode = c("logical", "double", "integer"), range = c(-100, +100), na_prob = 0) {
+     mode <- match.arg(mode)
+     if (mode == "logical") {
+         x <- sample(c(FALSE, TRUE), size = n, replace = TRUE)
+     }     else {
+         x <- runif(n, min = range[1], max = range[2])
+     }
+     storage.mode(x) <- mode
+     if (na_prob > 0)
+         x[sample(n, size = na_prob * n)] <- NA
+     x
+ }
> rvectors <- function(scale = 10, seed = 1, ...) {
+     set.seed(seed)
+     data <- list()
+     data[[1]] <- rvector(n = scale * 100, ...)
+     data[[2]] <- rvector(n = scale * 1000, ...)
+     data[[3]] <- rvector(n = scale * 10000, ...)
+     data[[4]] <- rvector(n = scale * 1e+05, ...)
+     data[[5]] <- rvector(n = scale * 1e+06, ...)
+     names(data) <- sprintf("n = %d", sapply(data, FUN = length))
+     data
+ }
> data <- rvectors(mode = "double")
> data <- data[1:4]
Results
n = 1000 vector
> x <- data[["n = 1000"]]
> gc()
           used  (Mb) gc trigger  (Mb) max used  (Mb)
Ncells  5343460 285.4    7916910 422.9  7916910 422.9
Vcells 13614354 103.9   36893127 281.5 57430649 438.2
> stats <- microbenchmark(logSumExp = logSumExp(x), logSumExp_R = logSumExp_R(x), unit = "ms")
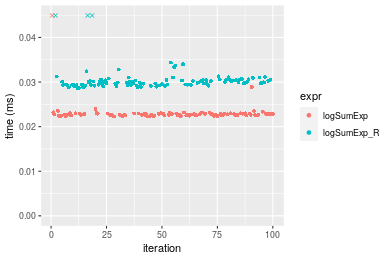
Table: Benchmarking of logSumExp() and logSumExp_R() on n = 1000 data. The top panel shows times in milliseconds and the bottom panel shows relative times.
| expr | min | lq | mean | median | uq | max | |
|---|---|---|---|---|---|---|---|
| 1 | logSumExp | 0.022266 | 0.0225450 | 0.0230288 | 0.0227255 | 0.022914 | 0.046002 |
| 2 | logSumExp_R | 0.028683 | 0.0294105 | 0.0308637 | 0.0299415 | 0.030497 | 0.064713 |
| expr | min | lq | mean | median | uq | max | |
|---|---|---|---|---|---|---|---|
| 1 | logSumExp | 1.000000 | 1.000000 | 1.00000 | 1.000000 | 1.000000 | 1.000000 |
| 2 | logSumExp_R | 1.288197 | 1.304524 | 1.34022 | 1.317529 | 1.330933 | 1.406743 |
Figure: Benchmarking of logSumExp() and logSumExp_R() on n = 1000 data. Outliers are displayed as crosses. Times are in milliseconds.
n = 10000 vector
> x <- data[["n = 10000"]]
> gc()
           used  (Mb) gc trigger  (Mb) max used  (Mb)
Ncells  5341232 285.3    7916910 422.9  7916910 422.9
Vcells 11429405  87.2   36893127 281.5 57430649 438.2
> stats <- microbenchmark(logSumExp = logSumExp(x), logSumExp_R = logSumExp_R(x), unit = "ms")
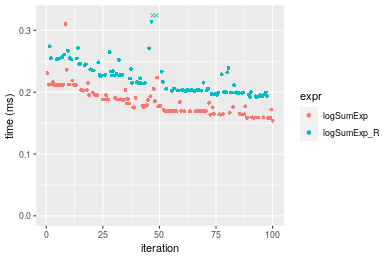
Table: Benchmarking of logSumExp() and logSumExp_R() on n = 10000 data. The top panel shows times in milliseconds and the bottom panel shows relative times.
| expr | min | lq | mean | median | uq | max | |
|---|---|---|---|---|---|---|---|
| 1 | logSumExp | 0.154077 | 0.1691225 | 0.1852944 | 0.1789375 | 0.2009460 | 0.310048 |
| 2 | logSumExp_R | 0.192103 | 0.2000760 | 0.2222996 | 0.2145080 | 0.2367025 | 0.353637 |
| expr | min | lq | mean | median | uq | max | |
|---|---|---|---|---|---|---|---|
| 1 | logSumExp | 1.000000 | 1.000000 | 1.00000 | 1.000000 | 1.000000 | 1.000000 |
| 2 | logSumExp_R | 1.246799 | 1.183024 | 1.19971 | 1.198787 | 1.177941 | 1.140588 |
Figure: Benchmarking of logSumExp() and logSumExp_R() on n = 10000 data. Outliers are displayed as crosses. Times are in milliseconds.
n = 100000 vector
> x <- data[["n = 100000"]]
> gc()
           used  (Mb) gc trigger  (Mb) max used  (Mb)
Ncells  5341295 285.3    7916910 422.9  7916910 422.9
Vcells 11429447  87.2   36893127 281.5 57430649 438.2
> stats <- microbenchmark(logSumExp = logSumExp(x), logSumExp_R = logSumExp_R(x), unit = "ms")
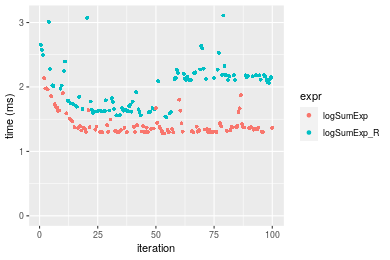
Table: Benchmarking of logSumExp() and logSumExp_R() on n = 100000 data. The top panel shows times in milliseconds and the bottom panel shows relative times.
| expr | min | lq | mean | median | uq | max | |
|---|---|---|---|---|---|---|---|
| 1 | logSumExp | 1.279054 | 1.306963 | 1.428666 | 1.364008 | 1.431050 | 2.133753 |
| 2 | logSumExp_R | 1.528733 | 1.656939 | 1.996871 | 2.083162 | 2.181539 | 3.109036 |
| expr | min | lq | mean | median | uq | max | |
|---|---|---|---|---|---|---|---|
| 1 | logSumExp | 1.000000 | 1.000000 | 1.000000 | 1.000000 | 1.000000 | 1.000000 |
| 2 | logSumExp_R | 1.195206 | 1.267778 | 1.397717 | 1.527235 | 1.524433 | 1.457074 |
Figure: Benchmarking of logSumExp() and logSumExp_R() on n = 100000 data. Outliers are displayed as crosses. Times are in milliseconds.
n = 1000000 vector
> x <- data[["n = 1000000"]]
> gc()
           used  (Mb) gc trigger  (Mb) max used  (Mb)
Ncells  5341358 285.3    7916910 422.9  7916910 422.9
Vcells 11430002  87.3   36893127 281.5 57430649 438.2
> stats <- microbenchmark(logSumExp = logSumExp(x), logSumExp_R = logSumExp_R(x), unit = "ms")
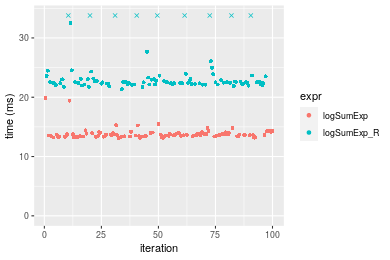
Table: Benchmarking of logSumExp() and logSumExp_R() on n = 1000000 data. The top panel shows times in milliseconds and the bottom panel shows relative times.
| expr | min | lq | mean | median | uq | max | |
|---|---|---|---|---|---|---|---|
| 1 | logSumExp | 13.13373 | 13.41856 | 13.84355 | 13.64258 | 13.93897 | 19.88573 |
| 2 | logSumExp_R | 21.35258 | 22.24761 | 24.18817 | 22.52311 | 23.08262 | 45.37122 |
| expr | min | lq | mean | median | uq | max | |
|---|---|---|---|---|---|---|---|
| 1 | logSumExp | 1.000000 | 1.000000 | 1.000000 | 1.000000 | 1.000000 | 1.000000 |
| 2 | logSumExp_R | 1.625782 | 1.657973 | 1.747252 | 1.650942 | 1.655978 | 2.281597 |
Figure: Benchmarking of logSumExp() and logSumExp_R() on n = 1000000 data. Outliers are displayed as crosses. Times are in milliseconds.
Appendix
Session information
R version 4.1.1 Patched (2021-08-10 r80727)
Platform: x86_64-pc-linux-gnu (64-bit)
Running under: Ubuntu 18.04.5 LTS

Matrix products: default
BLAS:   /home/hb/software/R-devel/R-4-1-branch/lib/R/lib/libRblas.so
LAPACK: /home/hb/software/R-devel/R-4-1-branch/lib/R/lib/libRlapack.so

locale:
 [1] LC_CTYPE=en_US.UTF-8       LC_NUMERIC=C
 [3] LC_TIME=en_US.UTF-8        LC_COLLATE=en_US.UTF-8
 [5] LC_MONETARY=en_US.UTF-8    LC_MESSAGES=en_US.UTF-8
 [7] LC_PAPER=en_US.UTF-8       LC_NAME=C
 [9] LC_ADDRESS=C               LC_TELEPHONE=C
[11] LC_MEASUREMENT=en_US.UTF-8 LC_IDENTIFICATION=C

attached base packages:
[1] stats     graphics  grDevices utils     datasets  methods   base

other attached packages:
[1] microbenchmark_1.4-7   matrixStats_0.60.0     ggplot2_3.3.5
[4] knitr_1.33             R.devices_2.17.0       R.utils_2.10.1
[7] R.oo_1.24.0            R.methodsS3_1.8.1-9001 history_0.0.1-9000

loaded via a namespace (and not attached):
 [1] Biobase_2.52.0          httr_1.4.2              splines_4.1.1
 [4] bit64_4.0.5             network_1.17.1          assertthat_0.2.1
 [7] highr_0.9               stats4_4.1.1            blob_1.2.2
[10] GenomeInfoDbData_1.2.6  robustbase_0.93-8       pillar_1.6.2
[13] RSQLite_2.2.8           lattice_0.20-44         glue_1.4.2
[16] digest_0.6.27           XVector_0.32.0          colorspace_2.0-2
[19] Matrix_1.3-4            XML_3.99-0.7            pkgconfig_2.0.3
[22] zlibbioc_1.38.0         genefilter_1.74.0       purrr_0.3.4
[25] ergm_4.1.2              xtable_1.8-4            scales_1.1.1
[28] tibble_3.1.4            annotate_1.70.0         KEGGREST_1.32.0
[31] farver_2.1.0            generics_0.1.0          IRanges_2.26.0
[34] ellipsis_0.3.2          cachem_1.0.6            withr_2.4.2
[37] BiocGenerics_0.38.0     mime_0.11               survival_3.2-13
[40] magrittr_2.0.1          crayon_1.4.1            statnet.common_4.5.0
[43] memoise_2.0.0           laeken_0.5.1            fansi_0.5.0
[46] R.cache_0.15.0          MASS_7.3-54             R.rsp_0.44.0
[49] progressr_0.8.0         tools_4.1.1             lifecycle_1.0.0
[52] S4Vectors_0.30.0        trust_0.1-8             munsell_0.5.0
[55] tabby_0.0.1-9001        AnnotationDbi_1.54.1    Biostrings_2.60.2
[58] compiler_4.1.1          GenomeInfoDb_1.28.1     rlang_0.4.11
[61] grid_4.1.1              RCurl_1.98-1.4          cwhmisc_6.6
[64] rstudioapi_0.13         rappdirs_0.3.3          startup_0.15.0-9000
[67] labeling_0.4.2          bitops_1.0-7            base64enc_0.1-3
[70] boot_1.3-28             gtable_0.3.0            DBI_1.1.1
[73] markdown_1.1            R6_2.5.1                lpSolveAPI_5.5.2.0-17.7
[76] rle_0.9.2               dplyr_1.0.7             fastmap_1.1.0
[79] bit_4.0.4               utf8_1.2.2              parallel_4.1.1
[82] Rcpp_1.0.7              vctrs_0.3.8             png_0.1-7
[85] DEoptimR_1.0-9          tidyselect_1.1.1        xfun_0.25
[88] coda_0.19-4
Total processing time was 9.79 secs.
Reproducibility
To reproduce this report, do:
html <- matrixStats:::benchmark('logSumExp')
Copyright Henrik Bengtsson. Last updated on 2021-08-25 22:35:28 (+0200 UTC). Powered by RSP.