matrixStats.benchmarks
colWeightedMedians() and rowWeightedMedians() benchmarks on subsetted computation
This report benchmark the performance of colWeightedMedians() and rowWeightedMedians on subsetted computation.
Data
> rmatrix <- function(nrow, ncol, mode = c("logical", "double", "integer", "index"), range = c(-100,
+     +100), na_prob = 0) {
+     mode <- match.arg(mode)
+     n <- nrow * ncol
+     if (mode == "logical") {
+         x <- sample(c(FALSE, TRUE), size = n, replace = TRUE)
+     }     else if (mode == "index") {
+         x <- seq_len(n)
+         mode <- "integer"
+     }     else {
+         x <- runif(n, min = range[1], max = range[2])
+     }
+     storage.mode(x) <- mode
+     if (na_prob > 0)
+         x[sample(n, size = na_prob * n)] <- NA
+     dim(x) <- c(nrow, ncol)
+     x
+ }
> rmatrices <- function(scale = 10, seed = 1, ...) {
+     set.seed(seed)
+     data <- list()
+     data[[1]] <- rmatrix(nrow = scale * 1, ncol = scale * 1, ...)
+     data[[2]] <- rmatrix(nrow = scale * 10, ncol = scale * 10, ...)
+     data[[3]] <- rmatrix(nrow = scale * 100, ncol = scale * 1, ...)
+     data[[4]] <- t(data[[3]])
+     data[[5]] <- rmatrix(nrow = scale * 10, ncol = scale * 100, ...)
+     data[[6]] <- t(data[[5]])
+     names(data) <- sapply(data, FUN = function(x) paste(dim(x), collapse = "x"))
+     data
+ }
> data <- rmatrices(mode = "double")
Results
10x10 matrix
> X <- data[["10x10"]]
> rows <- sample.int(nrow(X), size = nrow(X) * 0.7)
> cols <- sample.int(ncol(X), size = ncol(X) * 0.7)
> X_S <- X[rows, cols]
> w <- runif(nrow(X))
> w_S <- w[rows]
> gc()
           used  (Mb) gc trigger  (Mb) max used  (Mb)
Ncells  5334344 284.9    7916910 422.9  7916910 422.9
Vcells 10832800  82.7   33191153 253.3 53339345 407.0
> colStats <- microbenchmark(colWeightedMedians_X_w_S = colWeightedMedians(X_S, w = w_S, na.rm = FALSE),
+     `colWeightedMedians(X, w, rows, cols)` = colWeightedMedians(X, w = w, rows = rows, cols = cols,
+         na.rm = FALSE), `colWeightedMedians(X[rows, cols], w[rows])` = colWeightedMedians(X[rows,
+         cols], w = w[rows], na.rm = FALSE), unit = "ms")
> X <- t(X)
> X_S <- t(X_S)
> gc()
           used  (Mb) gc trigger  (Mb) max used  (Mb)
Ncells  5334550 284.9    7916910 422.9  7916910 422.9
Vcells 10833479  82.7   33191153 253.3 53339345 407.0
> rowStats <- microbenchmark(rowWeightedMedians_X_w_S = rowWeightedMedians(X_S, w = w_S, na.rm = FALSE),
+     `rowWeightedMedians(X, w, cols, rows)` = rowWeightedMedians(X, w = w, rows = cols, cols = rows,
+         na.rm = FALSE), `rowWeightedMedians(X[cols, rows], w[rows])` = rowWeightedMedians(X[cols,
+         rows], w = w[rows], na.rm = FALSE), unit = "ms")
Table: Benchmarking of colWeightedMedians_X_w_S(), colWeightedMedians(X, w, rows, cols)() and colWeightedMedians(X[rows, cols], w[rows])() on 10x10 data. The top panel shows times in milliseconds and the bottom panel shows relative times.
| expr | min | lq | mean | median | uq | max | |
|---|---|---|---|---|---|---|---|
| 1 | colWeightedMedians_X_w_S | 0.052626 | 0.055492 | 0.0598032 | 0.0591955 | 0.0639175 | 0.086218 |
| 3 | colWeightedMedians(X[rows, cols], w[rows]) | 0.054190 | 0.057296 | 0.0610951 | 0.0607215 | 0.0636040 | 0.078173 |
| 2 | colWeightedMedians(X, w, rows, cols) | 0.054722 | 0.057221 | 0.0661582 | 0.0607790 | 0.0654960 | 0.520724 |
| expr | min | lq | mean | median | uq | max | |
|---|---|---|---|---|---|---|---|
| 1 | colWeightedMedians_X_w_S | 1.000000 | 1.000000 | 1.000000 | 1.000000 | 1.0000000 | 1.00000 |
| 3 | colWeightedMedians(X[rows, cols], w[rows]) | 1.029719 | 1.032509 | 1.021602 | 1.025779 | 0.9950952 | 0.90669 |
| 2 | colWeightedMedians(X, w, rows, cols) | 1.039828 | 1.031158 | 1.106266 | 1.026750 | 1.0246959 | 6.03962 |
Table: Benchmarking of rowWeightedMedians_X_w_S(), rowWeightedMedians(X, w, cols, rows)() and rowWeightedMedians(X[cols, rows], w[rows])() on 10x10 data (transposed). The top panel shows times in milliseconds and the bottom panel shows relative times.
| expr | min | lq | mean | median | uq | max | |
|---|---|---|---|---|---|---|---|
| 3 | rowWeightedMedians(X[cols, rows], w[rows]) | 0.055853 | 0.0590680 | 0.0625646 | 0.0623145 | 0.0657520 | 0.074729 |
| 1 | rowWeightedMedians_X_w_S | 0.054368 | 0.0577385 | 0.0617549 | 0.0633800 | 0.0640265 | 0.076940 |
| 2 | rowWeightedMedians(X, w, cols, rows) | 0.056337 | 0.0591865 | 0.0674016 | 0.0634800 | 0.0662600 | 0.444226 |
| expr | min | lq | mean | median | uq | max | |
|---|---|---|---|---|---|---|---|
| 3 | rowWeightedMedians(X[cols, rows], w[rows]) | 1.0000000 | 1.000000 | 1.0000000 | 1.000000 | 1.0000000 | 1.000000 |
| 1 | rowWeightedMedians_X_w_S | 0.9734124 | 0.977492 | 0.9870577 | 1.017099 | 0.9737575 | 1.029587 |
| 2 | rowWeightedMedians(X, w, cols, rows) | 1.0086656 | 1.002006 | 1.0773124 | 1.018703 | 1.0077260 | 5.944493 |
Figure: Benchmarking of colWeightedMedians_X_w_S(), colWeightedMedians(X, w, rows, cols)() and colWeightedMedians(X[rows, cols], w[rows])() on 10x10 data as well as rowWeightedMedians_X_w_S(), rowWeightedMedians(X, w, cols, rows)() and rowWeightedMedians(X[cols, rows], w[rows])() on the same data transposed. Outliers are displayed as crosses. Times are in milliseconds.
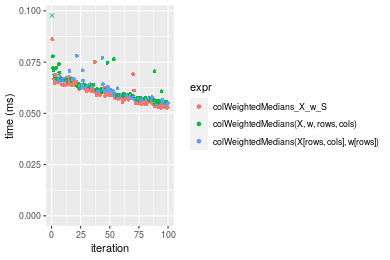
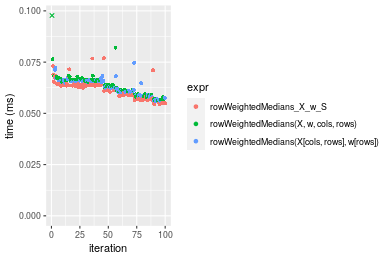 Table: Benchmarking of colWeightedMedians_X_w_S() and rowWeightedMedians_X_w_S() on 10x10 data (original and transposed). The top panel shows times in milliseconds and the bottom panel shows relative times.
| expr | min | lq | mean | median | uq | max | |
|---|---|---|---|---|---|---|---|
| 1 | colWeightedMedians_X_w_S | 52.626 | 55.4920 | 59.80320 | 59.1955 | 63.9175 | 86.218 |
| 2 | rowWeightedMedians_X_w_S | 54.368 | 57.7385 | 61.75488 | 63.3800 | 64.0265 | 76.940 |
| expr | min | lq | mean | median | uq | max | |
|---|---|---|---|---|---|---|---|
| 1 | colWeightedMedians_X_w_S | 1.000000 | 1.000000 | 1.000000 | 1.00000 | 1.000000 | 1.0000000 |
| 2 | rowWeightedMedians_X_w_S | 1.033101 | 1.040483 | 1.032635 | 1.07069 | 1.001705 | 0.8923891 |
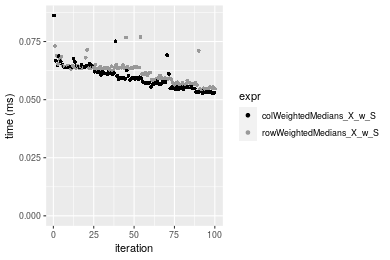
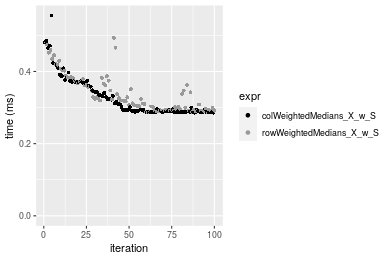
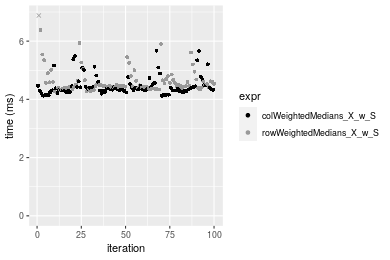
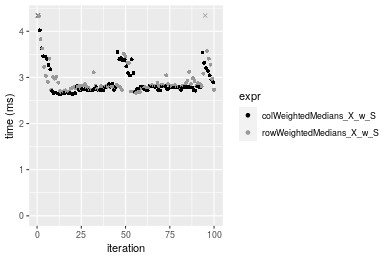
Figure: Benchmarking of colWeightedMedians_X_w_S() and rowWeightedMedians_X_w_S() on 10x10 data (original and transposed). Outliers are displayed as crosses. Times are in milliseconds.
100x100 matrix
> X <- data[["100x100"]]
> rows <- sample.int(nrow(X), size = nrow(X) * 0.7)
> cols <- sample.int(ncol(X), size = ncol(X) * 0.7)
> X_S <- X[rows, cols]
> w <- runif(nrow(X))
> w_S <- w[rows]
> gc()
           used  (Mb) gc trigger  (Mb) max used  (Mb)
Ncells  5333531 284.9    7916910 422.9  7916910 422.9
Vcells 10504819  80.2   33191153 253.3 53339345 407.0
> colStats <- microbenchmark(colWeightedMedians_X_w_S = colWeightedMedians(X_S, w = w_S, na.rm = FALSE),
+     `colWeightedMedians(X, w, rows, cols)` = colWeightedMedians(X, w = w, rows = rows, cols = cols,
+         na.rm = FALSE), `colWeightedMedians(X[rows, cols], w[rows])` = colWeightedMedians(X[rows,
+         cols], w = w[rows], na.rm = FALSE), unit = "ms")
> X <- t(X)
> X_S <- t(X_S)
> gc()
           used  (Mb) gc trigger  (Mb) max used  (Mb)
Ncells  5333525 284.9    7916910 422.9  7916910 422.9
Vcells 10514902  80.3   33191153 253.3 53339345 407.0
> rowStats <- microbenchmark(rowWeightedMedians_X_w_S = rowWeightedMedians(X_S, w = w_S, na.rm = FALSE),
+     `rowWeightedMedians(X, w, cols, rows)` = rowWeightedMedians(X, w = w, rows = cols, cols = rows,
+         na.rm = FALSE), `rowWeightedMedians(X[cols, rows], w[rows])` = rowWeightedMedians(X[cols,
+         rows], w = w[rows], na.rm = FALSE), unit = "ms")
Table: Benchmarking of colWeightedMedians_X_w_S(), colWeightedMedians(X, w, rows, cols)() and colWeightedMedians(X[rows, cols], w[rows])() on 100x100 data. The top panel shows times in milliseconds and the bottom panel shows relative times.
| expr | min | lq | mean | median | uq | max | |
|---|---|---|---|---|---|---|---|
| 1 | colWeightedMedians_X_w_S | 0.434137 | 0.4463780 | 0.5403734 | 0.4713315 | 0.5911655 | 1.070444 |
| 2 | colWeightedMedians(X, w, rows, cols) | 0.447466 | 0.4619700 | 0.5517239 | 0.5006270 | 0.5818170 | 1.107663 |
| 3 | colWeightedMedians(X[rows, cols], w[rows]) | 0.440669 | 0.4654005 | 0.5546191 | 0.5054815 | 0.5816365 | 1.110276 |
| expr | min | lq | mean | median | uq | max | |
|---|---|---|---|---|---|---|---|
| 1 | colWeightedMedians_X_w_S | 1.000000 | 1.000000 | 1.000000 | 1.000000 | 1.0000000 | 1.000000 |
| 2 | colWeightedMedians(X, w, rows, cols) | 1.030702 | 1.034930 | 1.021005 | 1.062155 | 0.9841863 | 1.034770 |
| 3 | colWeightedMedians(X[rows, cols], w[rows]) | 1.015046 | 1.042615 | 1.026363 | 1.072454 | 0.9838810 | 1.037211 |
Table: Benchmarking of rowWeightedMedians_X_w_S(), rowWeightedMedians(X, w, cols, rows)() and rowWeightedMedians(X[cols, rows], w[rows])() on 100x100 data (transposed). The top panel shows times in milliseconds and the bottom panel shows relative times.
| expr | min | lq | mean | median | uq | max | |
|---|---|---|---|---|---|---|---|
| 1 | rowWeightedMedians_X_w_S | 0.430554 | 0.4348235 | 0.4951498 | 0.4388405 | 0.5456995 | 0.750884 |
| 2 | rowWeightedMedians(X, w, cols, rows) | 0.440696 | 0.4455005 | 0.4825449 | 0.4496595 | 0.4980810 | 0.704190 |
| 3 | rowWeightedMedians(X[cols, rows], w[rows]) | 0.437534 | 0.4445915 | 0.4939047 | 0.4497360 | 0.4921610 | 0.860468 |
| expr | min | lq | mean | median | uq | max | |
|---|---|---|---|---|---|---|---|
| 1 | rowWeightedMedians_X_w_S | 1.000000 | 1.000000 | 1.0000000 | 1.000000 | 1.0000000 | 1.0000000 |
| 2 | rowWeightedMedians(X, w, cols, rows) | 1.023556 | 1.024555 | 0.9745433 | 1.024654 | 0.9127386 | 0.9378146 |
| 3 | rowWeightedMedians(X[cols, rows], w[rows]) | 1.016212 | 1.022464 | 0.9974855 | 1.024828 | 0.9018901 | 1.1459400 |
Figure: Benchmarking of colWeightedMedians_X_w_S(), colWeightedMedians(X, w, rows, cols)() and colWeightedMedians(X[rows, cols], w[rows])() on 100x100 data as well as rowWeightedMedians_X_w_S(), rowWeightedMedians(X, w, cols, rows)() and rowWeightedMedians(X[cols, rows], w[rows])() on the same data transposed. Outliers are displayed as crosses. Times are in milliseconds.
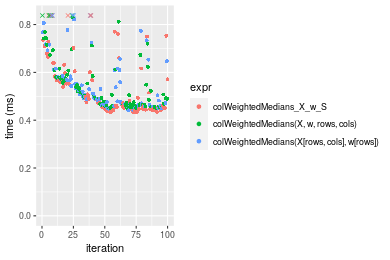
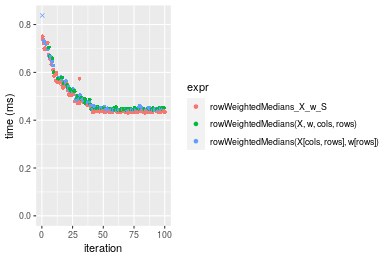 Table: Benchmarking of colWeightedMedians_X_w_S() and rowWeightedMedians_X_w_S() on 100x100 data (original and transposed). The top panel shows times in milliseconds and the bottom panel shows relative times.
| expr | min | lq | mean | median | uq | max | |
|---|---|---|---|---|---|---|---|
| 2 | rowWeightedMedians_X_w_S | 430.554 | 434.8235 | 495.1498 | 438.8405 | 545.6995 | 750.884 |
| 1 | colWeightedMedians_X_w_S | 434.137 | 446.3780 | 540.3734 | 471.3315 | 591.1655 | 1070.444 |
| expr | min | lq | mean | median | uq | max | |
|---|---|---|---|---|---|---|---|
| 2 | rowWeightedMedians_X_w_S | 1.000000 | 1.000000 | 1.000000 | 1.000000 | 1.000000 | 1.000000 |
| 1 | colWeightedMedians_X_w_S | 1.008322 | 1.026573 | 1.091333 | 1.074038 | 1.083317 | 1.425578 |
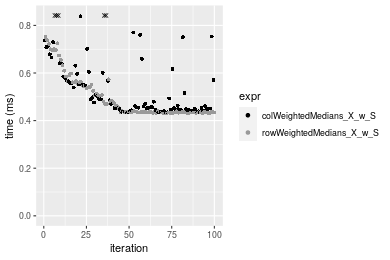
Figure: Benchmarking of colWeightedMedians_X_w_S() and rowWeightedMedians_X_w_S() on 100x100 data (original and transposed). Outliers are displayed as crosses. Times are in milliseconds.
1000x10 matrix
> X <- data[["1000x10"]]
> rows <- sample.int(nrow(X), size = nrow(X) * 0.7)
> cols <- sample.int(ncol(X), size = ncol(X) * 0.7)
> X_S <- X[rows, cols]
> w <- runif(nrow(X))
> w_S <- w[rows]
> gc()
           used  (Mb) gc trigger  (Mb) max used  (Mb)
Ncells  5334287 284.9    7916910 422.9  7916910 422.9
Vcells 10510793  80.2   33191153 253.3 53339345 407.0
> colStats <- microbenchmark(colWeightedMedians_X_w_S = colWeightedMedians(X_S, w = w_S, na.rm = FALSE),
+     `colWeightedMedians(X, w, rows, cols)` = colWeightedMedians(X, w = w, rows = rows, cols = cols,
+         na.rm = FALSE), `colWeightedMedians(X[rows, cols], w[rows])` = colWeightedMedians(X[rows,
+         cols], w = w[rows], na.rm = FALSE), unit = "ms")
> X <- t(X)
> X_S <- t(X_S)
> gc()
           used  (Mb) gc trigger  (Mb) max used  (Mb)
Ncells  5334275 284.9    7916910 422.9  7916910 422.9
Vcells 10520866  80.3   33191153 253.3 53339345 407.0
> rowStats <- microbenchmark(rowWeightedMedians_X_w_S = rowWeightedMedians(X_S, w = w_S, na.rm = FALSE),
+     `rowWeightedMedians(X, w, cols, rows)` = rowWeightedMedians(X, w = w, rows = cols, cols = rows,
+         na.rm = FALSE), `rowWeightedMedians(X[cols, rows], w[rows])` = rowWeightedMedians(X[cols,
+         rows], w = w[rows], na.rm = FALSE), unit = "ms")
Table: Benchmarking of colWeightedMedians_X_w_S(), colWeightedMedians(X, w, rows, cols)() and colWeightedMedians(X[rows, cols], w[rows])() on 1000x10 data. The top panel shows times in milliseconds and the bottom panel shows relative times.
| expr | min | lq | mean | median | uq | max | |
|---|---|---|---|---|---|---|---|
| 1 | colWeightedMedians_X_w_S | 0.285904 | 0.2884800 | 0.3284488 | 0.2955405 | 0.3679635 | 0.555002 |
| 3 | colWeightedMedians(X[rows, cols], w[rows]) | 0.299357 | 0.3028875 | 0.3375220 | 0.3071975 | 0.3751100 | 0.446226 |
| 2 | colWeightedMedians(X, w, rows, cols) | 0.300769 | 0.3049490 | 0.3497215 | 0.3093395 | 0.3873910 | 0.633478 |
| expr | min | lq | mean | median | uq | max | |
|---|---|---|---|---|---|---|---|
| 1 | colWeightedMedians_X_w_S | 1.000000 | 1.000000 | 1.000000 | 1.000000 | 1.000000 | 1.0000000 |
| 3 | colWeightedMedians(X[rows, cols], w[rows]) | 1.047054 | 1.049943 | 1.027625 | 1.039443 | 1.019422 | 0.8040079 |
| 2 | colWeightedMedians(X, w, rows, cols) | 1.051993 | 1.057089 | 1.064767 | 1.046691 | 1.052797 | 1.1413977 |
Table: Benchmarking of rowWeightedMedians_X_w_S(), rowWeightedMedians(X, w, cols, rows)() and rowWeightedMedians(X[cols, rows], w[rows])() on 1000x10 data (transposed). The top panel shows times in milliseconds and the bottom panel shows relative times.
| expr | min | lq | mean | median | uq | max | |
|---|---|---|---|---|---|---|---|
| 1 | rowWeightedMedians_X_w_S | 0.286450 | 0.2940310 | 0.3394324 | 0.3209085 | 0.3723010 | 0.492944 |
| 3 | rowWeightedMedians(X[cols, rows], w[rows]) | 0.303695 | 0.3103895 | 0.3630336 | 0.3476785 | 0.3924645 | 0.547230 |
| 2 | rowWeightedMedians(X, w, cols, rows) | 0.304607 | 0.3098190 | 0.3631793 | 0.3479245 | 0.3922800 | 0.634940 |
| expr | min | lq | mean | median | uq | max | |
|---|---|---|---|---|---|---|---|
| 1 | rowWeightedMedians_X_w_S | 1.000000 | 1.000000 | 1.000000 | 1.000000 | 1.000000 | 1.000000 |
| 3 | rowWeightedMedians(X[cols, rows], w[rows]) | 1.060202 | 1.055635 | 1.069531 | 1.083419 | 1.054159 | 1.110126 |
| 2 | rowWeightedMedians(X, w, cols, rows) | 1.063386 | 1.053695 | 1.069961 | 1.084186 | 1.053664 | 1.288057 |
Figure: Benchmarking of colWeightedMedians_X_w_S(), colWeightedMedians(X, w, rows, cols)() and colWeightedMedians(X[rows, cols], w[rows])() on 1000x10 data as well as rowWeightedMedians_X_w_S(), rowWeightedMedians(X, w, cols, rows)() and rowWeightedMedians(X[cols, rows], w[rows])() on the same data transposed. Outliers are displayed as crosses. Times are in milliseconds.
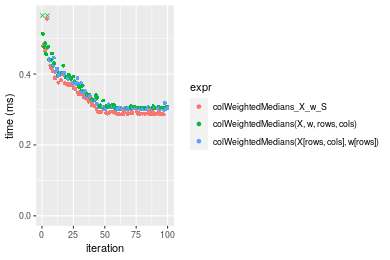
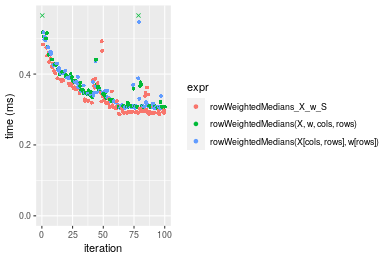 Table: Benchmarking of colWeightedMedians_X_w_S() and rowWeightedMedians_X_w_S() on 1000x10 data (original and transposed). The top panel shows times in milliseconds and the bottom panel shows relative times.
| expr | min | lq | mean | median | uq | max | |
|---|---|---|---|---|---|---|---|
| 1 | colWeightedMedians_X_w_S | 285.904 | 288.480 | 328.4488 | 295.5405 | 367.9635 | 555.002 |
| 2 | rowWeightedMedians_X_w_S | 286.450 | 294.031 | 339.4324 | 320.9085 | 372.3010 | 492.944 |
| expr | min | lq | mean | median | uq | max | |
|---|---|---|---|---|---|---|---|
| 1 | colWeightedMedians_X_w_S | 1.00000 | 1.000000 | 1.000000 | 1.000000 | 1.000000 | 1.0000000 |
| 2 | rowWeightedMedians_X_w_S | 1.00191 | 1.019242 | 1.033441 | 1.085836 | 1.011788 | 0.8881842 |
Figure: Benchmarking of colWeightedMedians_X_w_S() and rowWeightedMedians_X_w_S() on 1000x10 data (original and transposed). Outliers are displayed as crosses. Times are in milliseconds.
10x1000 matrix
> X <- data[["10x1000"]]
> rows <- sample.int(nrow(X), size = nrow(X) * 0.7)
> cols <- sample.int(ncol(X), size = ncol(X) * 0.7)
> X_S <- X[rows, cols]
> w <- runif(nrow(X))
> w_S <- w[rows]
> gc()
           used  (Mb) gc trigger  (Mb) max used  (Mb)
Ncells  5334493 284.9    7916910 422.9  7916910 422.9
Vcells 10510094  80.2   33191153 253.3 53339345 407.0
> colStats <- microbenchmark(colWeightedMedians_X_w_S = colWeightedMedians(X_S, w = w_S, na.rm = FALSE),
+     `colWeightedMedians(X, w, rows, cols)` = colWeightedMedians(X, w = w, rows = rows, cols = cols,
+         na.rm = FALSE), `colWeightedMedians(X[rows, cols], w[rows])` = colWeightedMedians(X[rows,
+         cols], w = w[rows], na.rm = FALSE), unit = "ms")
> X <- t(X)
> X_S <- t(X_S)
> gc()
           used  (Mb) gc trigger  (Mb) max used  (Mb)
Ncells  5334487 284.9    7916910 422.9  7916910 422.9
Vcells 10520177  80.3   33191153 253.3 53339345 407.0
> rowStats <- microbenchmark(rowWeightedMedians_X_w_S = rowWeightedMedians(X_S, w = w_S, na.rm = FALSE),
+     `rowWeightedMedians(X, w, cols, rows)` = rowWeightedMedians(X, w = w, rows = cols, cols = rows,
+         na.rm = FALSE), `rowWeightedMedians(X[cols, rows], w[rows])` = rowWeightedMedians(X[cols,
+         rows], w = w[rows], na.rm = FALSE), unit = "ms")
Table: Benchmarking of colWeightedMedians_X_w_S(), colWeightedMedians(X, w, rows, cols)() and colWeightedMedians(X[rows, cols], w[rows])() on 10x1000 data. The top panel shows times in milliseconds and the bottom panel shows relative times.
| expr | min | lq | mean | median | uq | max | |
|---|---|---|---|---|---|---|---|
| 1 | colWeightedMedians_X_w_S | 2.105473 | 2.268289 | 2.430364 | 2.317800 | 2.390839 | 8.856974 |
| 3 | colWeightedMedians(X[rows, cols], w[rows]) | 2.137962 | 2.283279 | 2.407698 | 2.335170 | 2.419733 | 3.559363 |
| 2 | colWeightedMedians(X, w, rows, cols) | 2.125799 | 2.309067 | 2.517231 | 2.347761 | 2.425774 | 8.769117 |
| expr | min | lq | mean | median | uq | max | |
|---|---|---|---|---|---|---|---|
| 1 | colWeightedMedians_X_w_S | 1.000000 | 1.000000 | 1.0000000 | 1.000000 | 1.000000 | 1.0000000 |
| 3 | colWeightedMedians(X[rows, cols], w[rows]) | 1.015431 | 1.006608 | 0.9906738 | 1.007494 | 1.012085 | 0.4018712 |
| 2 | colWeightedMedians(X, w, rows, cols) | 1.009654 | 1.017977 | 1.0357421 | 1.012927 | 1.014612 | 0.9900805 |
Table: Benchmarking of rowWeightedMedians_X_w_S(), rowWeightedMedians(X, w, cols, rows)() and rowWeightedMedians(X[cols, rows], w[rows])() on 10x1000 data (transposed). The top panel shows times in milliseconds and the bottom panel shows relative times.
| expr | min | lq | mean | median | uq | max | |
|---|---|---|---|---|---|---|---|
| 1 | rowWeightedMedians_X_w_S | 2.121931 | 2.233299 | 2.465462 | 2.321854 | 2.464652 | 8.613723 |
| 3 | rowWeightedMedians(X[cols, rows], w[rows]) | 2.137454 | 2.259781 | 2.473130 | 2.333979 | 2.424936 | 8.783698 |
| 2 | rowWeightedMedians(X, w, cols, rows) | 2.112333 | 2.248140 | 2.424102 | 2.335499 | 2.375852 | 8.750414 |
| expr | min | lq | mean | median | uq | max | |
|---|---|---|---|---|---|---|---|
| 1 | rowWeightedMedians_X_w_S | 1.0000000 | 1.000000 | 1.0000000 | 1.000000 | 1.0000000 | 1.000000 |
| 3 | rowWeightedMedians(X[cols, rows], w[rows]) | 1.0073155 | 1.011858 | 1.0031104 | 1.005222 | 0.9838856 | 1.019733 |
| 2 | rowWeightedMedians(X, w, cols, rows) | 0.9954768 | 1.006646 | 0.9832243 | 1.005877 | 0.9639704 | 1.015869 |
Figure: Benchmarking of colWeightedMedians_X_w_S(), colWeightedMedians(X, w, rows, cols)() and colWeightedMedians(X[rows, cols], w[rows])() on 10x1000 data as well as rowWeightedMedians_X_w_S(), rowWeightedMedians(X, w, cols, rows)() and rowWeightedMedians(X[cols, rows], w[rows])() on the same data transposed. Outliers are displayed as crosses. Times are in milliseconds.
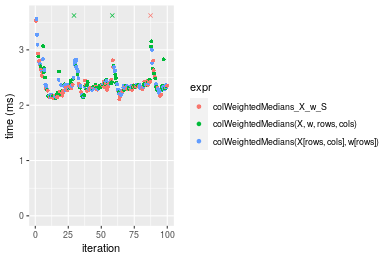
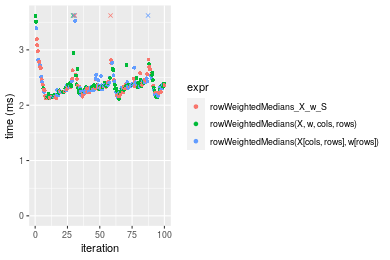 Table: Benchmarking of colWeightedMedians_X_w_S() and rowWeightedMedians_X_w_S() on 10x1000 data (original and transposed). The top panel shows times in milliseconds and the bottom panel shows relative times.
| expr | min | lq | mean | median | uq | max | |
|---|---|---|---|---|---|---|---|
| 1 | colWeightedMedians_X_w_S | 2.105473 | 2.268289 | 2.430364 | 2.317800 | 2.390839 | 8.856974 |
| 2 | rowWeightedMedians_X_w_S | 2.121931 | 2.233299 | 2.465462 | 2.321854 | 2.464652 | 8.613723 |
| expr | min | lq | mean | median | uq | max | |
|---|---|---|---|---|---|---|---|
| 1 | colWeightedMedians_X_w_S | 1.000000 | 1.0000000 | 1.000000 | 1.000000 | 1.000000 | 1.0000000 |
| 2 | rowWeightedMedians_X_w_S | 1.007817 | 0.9845741 | 1.014441 | 1.001749 | 1.030873 | 0.9725357 |
Figure: Benchmarking of colWeightedMedians_X_w_S() and rowWeightedMedians_X_w_S() on 10x1000 data (original and transposed). Outliers are displayed as crosses. Times are in milliseconds.
100x1000 matrix
> X <- data[["100x1000"]]
> rows <- sample.int(nrow(X), size = nrow(X) * 0.7)
> cols <- sample.int(ncol(X), size = ncol(X) * 0.7)
> X_S <- X[rows, cols]
> w <- runif(nrow(X))
> w_S <- w[rows]
> gc()
           used  (Mb) gc trigger  (Mb) max used  (Mb)
Ncells  5334707 285.0    7916910 422.9  7916910 422.9
Vcells 10555068  80.6   33191153 253.3 53339345 407.0
> colStats <- microbenchmark(colWeightedMedians_X_w_S = colWeightedMedians(X_S, w = w_S, na.rm = FALSE),
+     `colWeightedMedians(X, w, rows, cols)` = colWeightedMedians(X, w = w, rows = rows, cols = cols,
+         na.rm = FALSE), `colWeightedMedians(X[rows, cols], w[rows])` = colWeightedMedians(X[rows,
+         cols], w = w[rows], na.rm = FALSE), unit = "ms")
> X <- t(X)
> X_S <- t(X_S)
> gc()
           used  (Mb) gc trigger  (Mb) max used  (Mb)
Ncells  5334695 285.0    7916910 422.9  7916910 422.9
Vcells 10655141  81.3   33191153 253.3 53339345 407.0
> rowStats <- microbenchmark(rowWeightedMedians_X_w_S = rowWeightedMedians(X_S, w = w_S, na.rm = FALSE),
+     `rowWeightedMedians(X, w, cols, rows)` = rowWeightedMedians(X, w = w, rows = cols, cols = rows,
+         na.rm = FALSE), `rowWeightedMedians(X[cols, rows], w[rows])` = rowWeightedMedians(X[cols,
+         rows], w = w[rows], na.rm = FALSE), unit = "ms")
Table: Benchmarking of colWeightedMedians_X_w_S(), colWeightedMedians(X, w, rows, cols)() and colWeightedMedians(X[rows, cols], w[rows])() on 100x1000 data. The top panel shows times in milliseconds and the bottom panel shows relative times.
| expr | min | lq | mean | median | uq | max | |
|---|---|---|---|---|---|---|---|
| 1 | colWeightedMedians_X_w_S | 4.126185 | 4.298798 | 4.468813 | 4.359743 | 4.464126 | 5.675724 |
| 2 | colWeightedMedians(X, w, rows, cols) | 4.211187 | 4.397105 | 4.890707 | 4.463831 | 4.581053 | 19.973439 |
| 3 | colWeightedMedians(X[rows, cols], w[rows]) | 4.231171 | 4.395156 | 4.712517 | 4.474814 | 4.583891 | 19.211726 |
| expr | min | lq | mean | median | uq | max | |
|---|---|---|---|---|---|---|---|
| 1 | colWeightedMedians_X_w_S | 1.000000 | 1.000000 | 1.000000 | 1.000000 | 1.000000 | 1.000000 |
| 2 | colWeightedMedians(X, w, rows, cols) | 1.020601 | 1.022868 | 1.094408 | 1.023875 | 1.026193 | 3.519100 |
| 3 | colWeightedMedians(X[rows, cols], w[rows]) | 1.025444 | 1.022415 | 1.054534 | 1.026394 | 1.026828 | 3.384894 |
Table: Benchmarking of rowWeightedMedians_X_w_S(), rowWeightedMedians(X, w, cols, rows)() and rowWeightedMedians(X[cols, rows], w[rows])() on 100x1000 data (transposed). The top panel shows times in milliseconds and the bottom panel shows relative times.
| expr | min | lq | mean | median | uq | max | |
|---|---|---|---|---|---|---|---|
| 1 | rowWeightedMedians_X_w_S | 4.231641 | 4.399703 | 4.631424 | 4.461740 | 4.635045 | 6.997573 |
| 3 | rowWeightedMedians(X[cols, rows], w[rows]) | 4.256076 | 4.479400 | 4.771082 | 4.530139 | 4.653082 | 19.360516 |
| 2 | rowWeightedMedians(X, w, cols, rows) | 4.239604 | 4.451703 | 4.947578 | 4.550002 | 4.693646 | 21.368131 |
| expr | min | lq | mean | median | uq | max | |
|---|---|---|---|---|---|---|---|
| 1 | rowWeightedMedians_X_w_S | 1.000000 | 1.000000 | 1.000000 | 1.000000 | 1.000000 | 1.000000 |
| 3 | rowWeightedMedians(X[cols, rows], w[rows]) | 1.005774 | 1.018114 | 1.030154 | 1.015330 | 1.003891 | 2.766747 |
| 2 | rowWeightedMedians(X, w, cols, rows) | 1.001882 | 1.011819 | 1.068263 | 1.019782 | 1.012643 | 3.053649 |
Figure: Benchmarking of colWeightedMedians_X_w_S(), colWeightedMedians(X, w, rows, cols)() and colWeightedMedians(X[rows, cols], w[rows])() on 100x1000 data as well as rowWeightedMedians_X_w_S(), rowWeightedMedians(X, w, cols, rows)() and rowWeightedMedians(X[cols, rows], w[rows])() on the same data transposed. Outliers are displayed as crosses. Times are in milliseconds.
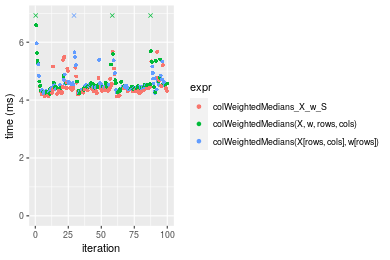
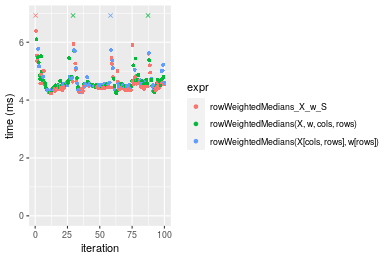 Table: Benchmarking of colWeightedMedians_X_w_S() and rowWeightedMedians_X_w_S() on 100x1000 data (original and transposed). The top panel shows times in milliseconds and the bottom panel shows relative times.
| expr | min | lq | mean | median | uq | max | |
|---|---|---|---|---|---|---|---|
| 1 | colWeightedMedians_X_w_S | 4.126185 | 4.298798 | 4.468813 | 4.359743 | 4.464126 | 5.675724 |
| 2 | rowWeightedMedians_X_w_S | 4.231641 | 4.399703 | 4.631424 | 4.461740 | 4.635045 | 6.997573 |
| expr | min | lq | mean | median | uq | max | |
|---|---|---|---|---|---|---|---|
| 1 | colWeightedMedians_X_w_S | 1.000000 | 1.000000 | 1.000000 | 1.000000 | 1.000000 | 1.000000 |
| 2 | rowWeightedMedians_X_w_S | 1.025558 | 1.023473 | 1.036388 | 1.023395 | 1.038287 | 1.232895 |
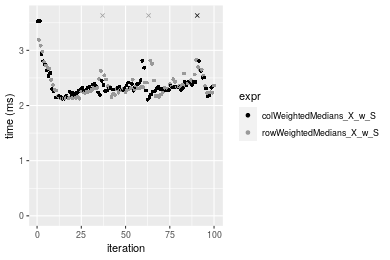
Figure: Benchmarking of colWeightedMedians_X_w_S() and rowWeightedMedians_X_w_S() on 100x1000 data (original and transposed). Outliers are displayed as crosses. Times are in milliseconds.
1000x100 matrix
> X <- data[["1000x100"]]
> rows <- sample.int(nrow(X), size = nrow(X) * 0.7)
> cols <- sample.int(ncol(X), size = ncol(X) * 0.7)
> X_S <- X[rows, cols]
> w <- runif(nrow(X))
> w_S <- w[rows]
> gc()
           used  (Mb) gc trigger  (Mb) max used  (Mb)
Ncells  5334913 285.0    7916910 422.9  7916910 422.9
Vcells 10557403  80.6   33191153 253.3 53339345 407.0
> colStats <- microbenchmark(colWeightedMedians_X_w_S = colWeightedMedians(X_S, w = w_S, na.rm = FALSE),
+     `colWeightedMedians(X, w, rows, cols)` = colWeightedMedians(X, w = w, rows = rows, cols = cols,
+         na.rm = FALSE), `colWeightedMedians(X[rows, cols], w[rows])` = colWeightedMedians(X[rows,
+         cols], w = w[rows], na.rm = FALSE), unit = "ms")
> X <- t(X)
> X_S <- t(X_S)
> gc()
           used  (Mb) gc trigger  (Mb) max used  (Mb)
Ncells  5334901 285.0    7916910 422.9  7916910 422.9
Vcells 10657476  81.4   33191153 253.3 53339345 407.0
> rowStats <- microbenchmark(rowWeightedMedians_X_w_S = rowWeightedMedians(X_S, w = w_S, na.rm = FALSE),
+     `rowWeightedMedians(X, w, cols, rows)` = rowWeightedMedians(X, w = w, rows = cols, cols = rows,
+         na.rm = FALSE), `rowWeightedMedians(X[cols, rows], w[rows])` = rowWeightedMedians(X[cols,
+         rows], w = w[rows], na.rm = FALSE), unit = "ms")
Table: Benchmarking of colWeightedMedians_X_w_S(), colWeightedMedians(X, w, rows, cols)() and colWeightedMedians(X[rows, cols], w[rows])() on 1000x100 data. The top panel shows times in milliseconds and the bottom panel shows relative times.
| expr | min | lq | mean | median | uq | max | |
|---|---|---|---|---|---|---|---|
| 1 | colWeightedMedians_X_w_S | 2.633460 | 2.727588 | 2.900070 | 2.792244 | 2.879844 | 4.390126 |
| 2 | colWeightedMedians(X, w, rows, cols) | 2.745008 | 2.824676 | 3.107675 | 2.888164 | 2.921382 | 12.395477 |
| 3 | colWeightedMedians(X[rows, cols], w[rows]) | 2.750645 | 2.834135 | 2.966980 | 2.897008 | 2.933892 | 4.522327 |
| expr | min | lq | mean | median | uq | max | |
|---|---|---|---|---|---|---|---|
| 1 | colWeightedMedians_X_w_S | 1.000000 | 1.000000 | 1.000000 | 1.000000 | 1.000000 | 1.000000 |
| 2 | colWeightedMedians(X, w, rows, cols) | 1.042358 | 1.035595 | 1.071586 | 1.034353 | 1.014424 | 2.823490 |
| 3 | colWeightedMedians(X[rows, cols], w[rows]) | 1.044498 | 1.039063 | 1.023072 | 1.037520 | 1.018768 | 1.030113 |
Table: Benchmarking of rowWeightedMedians_X_w_S(), rowWeightedMedians(X, w, cols, rows)() and rowWeightedMedians(X[cols, rows], w[rows])() on 1000x100 data (transposed). The top panel shows times in milliseconds and the bottom panel shows relative times.
| expr | min | lq | mean | median | uq | max | |
|---|---|---|---|---|---|---|---|
| 1 | rowWeightedMedians_X_w_S | 2.663706 | 2.772612 | 2.986389 | 2.811904 | 2.910218 | 11.293295 |
| 2 | rowWeightedMedians(X, w, cols, rows) | 2.779964 | 2.864292 | 3.134994 | 2.936345 | 3.064936 | 11.821283 |
| 3 | rowWeightedMedians(X[cols, rows], w[rows]) | 2.768421 | 2.876955 | 3.035010 | 2.948023 | 3.041638 | 4.027716 |
| expr | min | lq | mean | median | uq | max | |
|---|---|---|---|---|---|---|---|
| 1 | rowWeightedMedians_X_w_S | 1.000000 | 1.000000 | 1.000000 | 1.000000 | 1.000000 | 1.0000000 |
| 2 | rowWeightedMedians(X, w, cols, rows) | 1.043645 | 1.033066 | 1.049761 | 1.044255 | 1.053164 | 1.0467523 |
| 3 | rowWeightedMedians(X[cols, rows], w[rows]) | 1.039312 | 1.037634 | 1.016281 | 1.048408 | 1.045158 | 0.3566467 |
Figure: Benchmarking of colWeightedMedians_X_w_S(), colWeightedMedians(X, w, rows, cols)() and colWeightedMedians(X[rows, cols], w[rows])() on 1000x100 data as well as rowWeightedMedians_X_w_S(), rowWeightedMedians(X, w, cols, rows)() and rowWeightedMedians(X[cols, rows], w[rows])() on the same data transposed. Outliers are displayed as crosses. Times are in milliseconds.
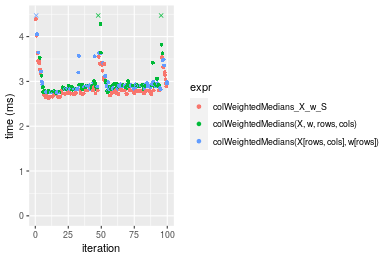
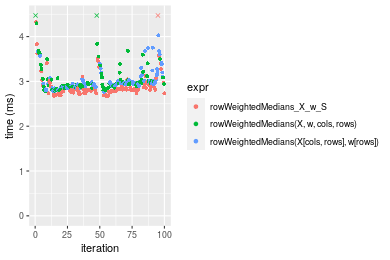 Table: Benchmarking of colWeightedMedians_X_w_S() and rowWeightedMedians_X_w_S() on 1000x100 data (original and transposed). The top panel shows times in milliseconds and the bottom panel shows relative times.
| expr | min | lq | mean | median | uq | max | |
|---|---|---|---|---|---|---|---|
| 1 | colWeightedMedians_X_w_S | 2.633460 | 2.727588 | 2.900070 | 2.792244 | 2.879844 | 4.390126 |
| 2 | rowWeightedMedians_X_w_S | 2.663706 | 2.772612 | 2.986389 | 2.811904 | 2.910218 | 11.293295 |
| expr | min | lq | mean | median | uq | max | |
|---|---|---|---|---|---|---|---|
| 1 | colWeightedMedians_X_w_S | 1.000000 | 1.000000 | 1.000000 | 1.000000 | 1.000000 | 1.000000 |
| 2 | rowWeightedMedians_X_w_S | 1.011485 | 1.016507 | 1.029764 | 1.007041 | 1.010547 | 2.572431 |
Figure: Benchmarking of colWeightedMedians_X_w_S() and rowWeightedMedians_X_w_S() on 1000x100 data (original and transposed). Outliers are displayed as crosses. Times are in milliseconds.
Appendix
Session information
R version 4.1.1 Patched (2021-08-10 r80727)
Platform: x86_64-pc-linux-gnu (64-bit)
Running under: Ubuntu 18.04.5 LTS

Matrix products: default
BLAS:   /home/hb/software/R-devel/R-4-1-branch/lib/R/lib/libRblas.so
LAPACK: /home/hb/software/R-devel/R-4-1-branch/lib/R/lib/libRlapack.so

locale:
 [1] LC_CTYPE=en_US.UTF-8       LC_NUMERIC=C
 [3] LC_TIME=en_US.UTF-8        LC_COLLATE=en_US.UTF-8
 [5] LC_MONETARY=en_US.UTF-8    LC_MESSAGES=en_US.UTF-8
 [7] LC_PAPER=en_US.UTF-8       LC_NAME=C
 [9] LC_ADDRESS=C               LC_TELEPHONE=C
[11] LC_MEASUREMENT=en_US.UTF-8 LC_IDENTIFICATION=C

attached base packages:
[1] stats     graphics  grDevices utils     datasets  methods   base

other attached packages:
[1] microbenchmark_1.4-7   matrixStats_0.60.0     ggplot2_3.3.5
[4] knitr_1.33             R.devices_2.17.0       R.utils_2.10.1
[7] R.oo_1.24.0            R.methodsS3_1.8.1-9001 history_0.0.1-9000

loaded via a namespace (and not attached):
 [1] Biobase_2.52.0          httr_1.4.2              splines_4.1.1
 [4] bit64_4.0.5             network_1.17.1          assertthat_0.2.1
 [7] highr_0.9               stats4_4.1.1            blob_1.2.2
[10] GenomeInfoDbData_1.2.6  robustbase_0.93-8       pillar_1.6.2
[13] RSQLite_2.2.8           lattice_0.20-44         glue_1.4.2
[16] digest_0.6.27           XVector_0.32.0          colorspace_2.0-2
[19] Matrix_1.3-4            XML_3.99-0.7            pkgconfig_2.0.3
[22] zlibbioc_1.38.0         genefilter_1.74.0       purrr_0.3.4
[25] ergm_4.1.2              xtable_1.8-4            scales_1.1.1
[28] tibble_3.1.4            annotate_1.70.0         KEGGREST_1.32.0
[31] farver_2.1.0            generics_0.1.0          IRanges_2.26.0
[34] ellipsis_0.3.2          cachem_1.0.6            withr_2.4.2
[37] BiocGenerics_0.38.0     mime_0.11               survival_3.2-13
[40] magrittr_2.0.1          crayon_1.4.1            statnet.common_4.5.0
[43] memoise_2.0.0           laeken_0.5.1            fansi_0.5.0
[46] R.cache_0.15.0          MASS_7.3-54             R.rsp_0.44.0
[49] progressr_0.8.0         tools_4.1.1             lifecycle_1.0.0
[52] S4Vectors_0.30.0        trust_0.1-8             munsell_0.5.0
[55] tabby_0.0.1-9001        AnnotationDbi_1.54.1    Biostrings_2.60.2
[58] compiler_4.1.1          GenomeInfoDb_1.28.1     rlang_0.4.11
[61] grid_4.1.1              RCurl_1.98-1.4          cwhmisc_6.6
[64] rstudioapi_0.13         rappdirs_0.3.3          startup_0.15.0
[67] labeling_0.4.2          bitops_1.0-7            base64enc_0.1-3
[70] boot_1.3-28             gtable_0.3.0            DBI_1.1.1
[73] markdown_1.1            R6_2.5.1                lpSolveAPI_5.5.2.0-17.7
[76] rle_0.9.2               dplyr_1.0.7             fastmap_1.1.0
[79] bit_4.0.4               utf8_1.2.2              parallel_4.1.1
[82] Rcpp_1.0.7              vctrs_0.3.8             png_0.1-7
[85] DEoptimR_1.0-9          tidyselect_1.1.1        xfun_0.25
[88] coda_0.19-4
Total processing time was 18.9 secs.
Reproducibility
To reproduce this report, do:
html <- matrixStats:::benchmark('colRowWeightedMedians_subset')
Copyright Dongcan Jiang. Last updated on 2021-08-25 22:32:30 (+0200 UTC). Powered by RSP.