matrixStats.benchmarks
colTabulates() and rowTabulates() benchmarks
This report benchmark the performance of colTabulates() and rowTabulates() against alternative methods.
Alternative methods
- ???
Data
> rmatrix <- function(nrow, ncol, mode = c("logical", "double", "integer", "index"), range = c(-100,
+     +100), na_prob = 0) {
+     mode <- match.arg(mode)
+     n <- nrow * ncol
+     if (mode == "logical") {
+         x <- sample(c(FALSE, TRUE), size = n, replace = TRUE)
+     }     else if (mode == "index") {
+         x <- seq_len(n)
+         mode <- "integer"
+     }     else {
+         x <- runif(n, min = range[1], max = range[2])
+     }
+     storage.mode(x) <- mode
+     if (na_prob > 0)
+         x[sample(n, size = na_prob * n)] <- NA
+     dim(x) <- c(nrow, ncol)
+     x
+ }
> rmatrices <- function(scale = 10, seed = 1, ...) {
+     set.seed(seed)
+     data <- list()
+     data[[1]] <- rmatrix(nrow = scale * 1, ncol = scale * 1, ...)
+     data[[2]] <- rmatrix(nrow = scale * 10, ncol = scale * 10, ...)
+     data[[3]] <- rmatrix(nrow = scale * 100, ncol = scale * 1, ...)
+     data[[4]] <- t(data[[3]])
+     data[[5]] <- rmatrix(nrow = scale * 10, ncol = scale * 100, ...)
+     data[[6]] <- t(data[[5]])
+     names(data) <- sapply(data, FUN = function(x) paste(dim(x), collapse = "x"))
+     data
+ }
> data <- rmatrices(mode = "integer", range = c(-10, 10))
Results
10x10 matrix
> X <- data[["10x10"]]
> gc()
           used  (Mb) gc trigger  (Mb) max used  (Mb)
Ncells  5312972 283.8    7916910 422.9  7916910 422.9
Vcells 10426587  79.6   33191153 253.3 53339345 407.0
> colStats <- microbenchmark(colTabulates = colTabulates(X, na.rm = FALSE), unit = "ms")
> X <- t(X)
> gc()
           used  (Mb) gc trigger  (Mb) max used  (Mb)
Ncells  5312566 283.8    7916910 422.9  7916910 422.9
Vcells 10425459  79.6   33191153 253.3 53339345 407.0
> rowStats <- microbenchmark(rowTabulates = rowTabulates(X, na.rm = FALSE), unit = "ms")
Table: Benchmarking of colTabulates() on 10x10 data. The top panel shows times in milliseconds and the bottom panel shows relative times.
| expr | min | lq | mean | median | uq | max | |
|---|---|---|---|---|---|---|---|
| 1 | colTabulates | 0.19669 | 0.2165795 | 0.2348012 | 0.2304595 | 0.2499735 | 0.40226 |
| expr | min | lq | mean | median | uq | max | |
|---|---|---|---|---|---|---|---|
| 1 | colTabulates | 1 | 1 | 1 | 1 | 1 | 1 |
Table: Benchmarking of rowTabulates() on 10x10 data (transposed). The top panel shows times in milliseconds and the bottom panel shows relative times.
| expr | min | lq | mean | median | uq | max | |
|---|---|---|---|---|---|---|---|
| 1 | rowTabulates | 0.189191 | 0.204201 | 0.2198739 | 0.2167605 | 0.231946 | 0.401605 |
| expr | min | lq | mean | median | uq | max | |
|---|---|---|---|---|---|---|---|
| 1 | rowTabulates | 1 | 1 | 1 | 1 | 1 | 1 |
Figure: Benchmarking of colTabulates() on 10x10 data as well as rowTabulates() on the same data transposed. Outliers are displayed as crosses. Times are in milliseconds.
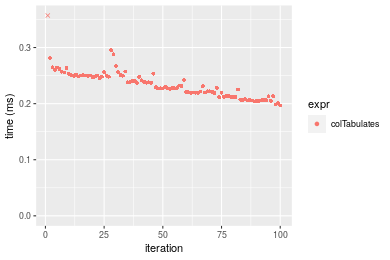
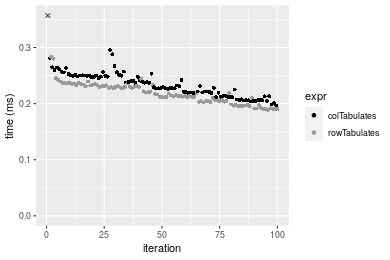
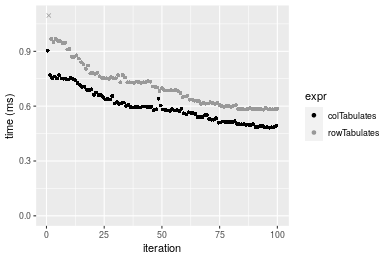
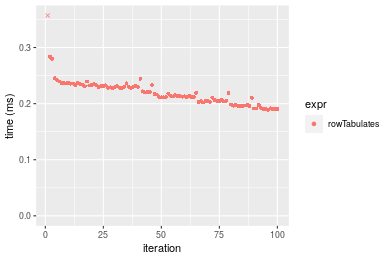 Table: Benchmarking of colTabulates() and rowTabulates() on 10x10 data (original and transposed). The top panel shows times in milliseconds and the bottom panel shows relative times.
| expr | min | lq | mean | median | uq | max | |
|---|---|---|---|---|---|---|---|
| 2 | rowTabulates | 189.191 | 204.2010 | 219.8739 | 216.7605 | 231.9460 | 401.605 |
| 1 | colTabulates | 196.690 | 216.5795 | 234.8012 | 230.4595 | 249.9735 | 402.260 |
| expr | min | lq | mean | median | uq | max | |
|---|---|---|---|---|---|---|---|
| 2 | rowTabulates | 1.000000 | 1.000000 | 1.00000 | 1.000000 | 1.000000 | 1.000000 |
| 1 | colTabulates | 1.039637 | 1.060619 | 1.06789 | 1.063199 | 1.077723 | 1.001631 |
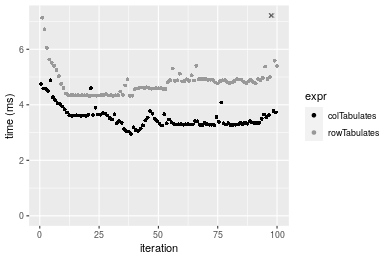
Figure: Benchmarking of colTabulates() and rowTabulates() on 10x10 data (original and transposed). Outliers are displayed as crosses. Times are in milliseconds.
100x100 matrix
> X <- data[["100x100"]]
> gc()
           used  (Mb) gc trigger  (Mb) max used  (Mb)
Ncells  5311073 283.7    7916910 422.9  7916910 422.9
Vcells 10231012  78.1   33191153 253.3 53339345 407.0
> colStats <- microbenchmark(colTabulates = colTabulates(X, na.rm = FALSE), unit = "ms")
> X <- t(X)
> gc()
           used  (Mb) gc trigger  (Mb) max used  (Mb)
Ncells  5311067 283.7    7916910 422.9  7916910 422.9
Vcells 10236055  78.1   33191153 253.3 53339345 407.0
> rowStats <- microbenchmark(rowTabulates = rowTabulates(X, na.rm = FALSE), unit = "ms")
Table: Benchmarking of colTabulates() on 100x100 data. The top panel shows times in milliseconds and the bottom panel shows relative times.
| expr | min | lq | mean | median | uq | max | |
|---|---|---|---|---|---|---|---|
| 1 | colTabulates | 0.48234 | 0.5168785 | 0.5979108 | 0.5827735 | 0.6529605 | 0.903825 |
| expr | min | lq | mean | median | uq | max | |
|---|---|---|---|---|---|---|---|
| 1 | colTabulates | 1 | 1 | 1 | 1 | 1 | 1 |
Table: Benchmarking of rowTabulates() on 100x100 data (transposed). The top panel shows times in milliseconds and the bottom panel shows relative times.
| expr | min | lq | mean | median | uq | max | |
|---|---|---|---|---|---|---|---|
| 1 | rowTabulates | 0.58075 | 0.6050025 | 0.7095906 | 0.689075 | 0.761424 | 1.098079 |
| expr | min | lq | mean | median | uq | max | |
|---|---|---|---|---|---|---|---|
| 1 | rowTabulates | 1 | 1 | 1 | 1 | 1 | 1 |
Figure: Benchmarking of colTabulates() on 100x100 data as well as rowTabulates() on the same data transposed. Outliers are displayed as crosses. Times are in milliseconds.
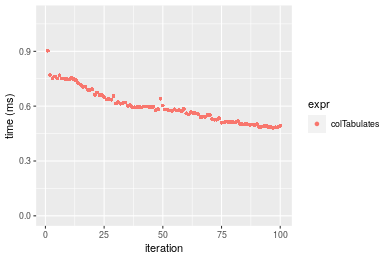
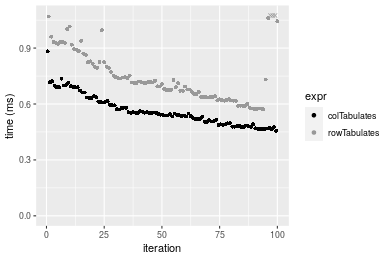
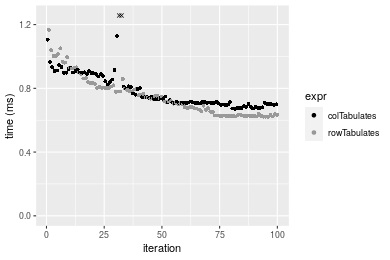
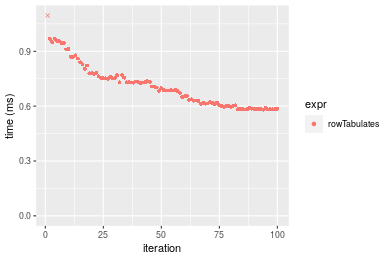 Table: Benchmarking of colTabulates() and rowTabulates() on 100x100 data (original and transposed). The top panel shows times in milliseconds and the bottom panel shows relative times.
| expr | min | lq | mean | median | uq | max | |
|---|---|---|---|---|---|---|---|
| 1 | colTabulates | 482.34 | 516.8785 | 597.9108 | 582.7735 | 652.9605 | 903.825 |
| 2 | rowTabulates | 580.75 | 605.0025 | 709.5906 | 689.0750 | 761.4240 | 1098.079 |
| expr | min | lq | mean | median | uq | max | |
|---|---|---|---|---|---|---|---|
| 1 | colTabulates | 1.000000 | 1.000000 | 1.000000 | 1.000000 | 1.00000 | 1.000000 |
| 2 | rowTabulates | 1.204026 | 1.170493 | 1.186783 | 1.182406 | 1.16611 | 1.214924 |
Figure: Benchmarking of colTabulates() and rowTabulates() on 100x100 data (original and transposed). Outliers are displayed as crosses. Times are in milliseconds.
1000x10 matrix
> X <- data[["1000x10"]]
> gc()
           used  (Mb) gc trigger  (Mb) max used  (Mb)
Ncells  5311783 283.7    7916910 422.9  7916910 422.9
Vcells 10234297  78.1   33191153 253.3 53339345 407.0
> colStats <- microbenchmark(colTabulates = colTabulates(X, na.rm = FALSE), unit = "ms")
> X <- t(X)
> gc()
           used  (Mb) gc trigger  (Mb) max used  (Mb)
Ncells  5311777 283.7    7916910 422.9  7916910 422.9
Vcells 10239340  78.2   33191153 253.3 53339345 407.0
> rowStats <- microbenchmark(rowTabulates = rowTabulates(X, na.rm = FALSE), unit = "ms")
Table: Benchmarking of colTabulates() on 1000x10 data. The top panel shows times in milliseconds and the bottom panel shows relative times.
| expr | min | lq | mean | median | uq | max | |
|---|---|---|---|---|---|---|---|
| 1 | colTabulates | 0.455727 | 0.4966905 | 0.5633653 | 0.5477525 | 0.6110225 | 0.882606 |
| expr | min | lq | mean | median | uq | max | |
|---|---|---|---|---|---|---|---|
| 1 | colTabulates | 1 | 1 | 1 | 1 | 1 | 1 |
Table: Benchmarking of rowTabulates() on 1000x10 data (transposed). The top panel shows times in milliseconds and the bottom panel shows relative times.
| expr | min | lq | mean | median | uq | max | |
|---|---|---|---|---|---|---|---|
| 1 | rowTabulates | 0.572059 | 0.6382925 | 0.7512468 | 0.71464 | 0.825404 | 1.202477 |
| expr | min | lq | mean | median | uq | max | |
|---|---|---|---|---|---|---|---|
| 1 | rowTabulates | 1 | 1 | 1 | 1 | 1 | 1 |
Figure: Benchmarking of colTabulates() on 1000x10 data as well as rowTabulates() on the same data transposed. Outliers are displayed as crosses. Times are in milliseconds.
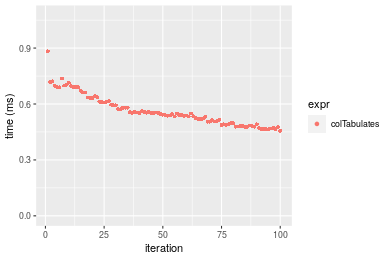
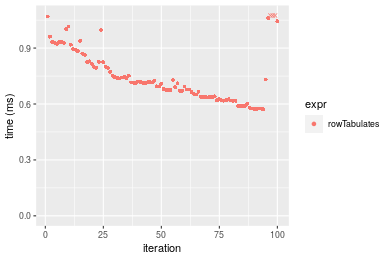 Table: Benchmarking of colTabulates() and rowTabulates() on 1000x10 data (original and transposed). The top panel shows times in milliseconds and the bottom panel shows relative times.
| expr | min | lq | mean | median | uq | max | |
|---|---|---|---|---|---|---|---|
| 1 | colTabulates | 455.727 | 496.6905 | 563.3653 | 547.7525 | 611.0225 | 882.606 |
| 2 | rowTabulates | 572.059 | 638.2925 | 751.2468 | 714.6400 | 825.4040 | 1202.477 |
| expr | min | lq | mean | median | uq | max | |
|---|---|---|---|---|---|---|---|
| 1 | colTabulates | 1.000000 | 1.000000 | 1.000000 | 1.000000 | 1.000000 | 1.000000 |
| 2 | rowTabulates | 1.255267 | 1.285091 | 1.333499 | 1.304677 | 1.350857 | 1.362416 |
Figure: Benchmarking of colTabulates() and rowTabulates() on 1000x10 data (original and transposed). Outliers are displayed as crosses. Times are in milliseconds.
10x1000 matrix
> X <- data[["10x1000"]]
> gc()
           used  (Mb) gc trigger  (Mb) max used  (Mb)
Ncells  5311954 283.7    7916910 422.9  7916910 422.9
Vcells 10234877  78.1   33191153 253.3 53339345 407.0
> colStats <- microbenchmark(colTabulates = colTabulates(X, na.rm = FALSE), unit = "ms")
> X <- t(X)
> gc()
           used  (Mb) gc trigger  (Mb) max used  (Mb)
Ncells  5311948 283.7    7916910 422.9  7916910 422.9
Vcells 10239920  78.2   33191153 253.3 53339345 407.0
> rowStats <- microbenchmark(rowTabulates = rowTabulates(X, na.rm = FALSE), unit = "ms")
Table: Benchmarking of colTabulates() on 10x1000 data. The top panel shows times in milliseconds and the bottom panel shows relative times.
| expr | min | lq | mean | median | uq | max | |
|---|---|---|---|---|---|---|---|
| 1 | colTabulates | 0.67164 | 0.70546 | 0.790456 | 0.734978 | 0.8896275 | 1.354405 |
| expr | min | lq | mean | median | uq | max | |
|---|---|---|---|---|---|---|---|
| 1 | colTabulates | 1 | 1 | 1 | 1 | 1 | 1 |
Table: Benchmarking of rowTabulates() on 10x1000 data (transposed). The top panel shows times in milliseconds and the bottom panel shows relative times.
| expr | min | lq | mean | median | uq | max | |
|---|---|---|---|---|---|---|---|
| 1 | rowTabulates | 0.621013 | 0.6341315 | 0.7509423 | 0.726829 | 0.8070165 | 1.167277 |
| expr | min | lq | mean | median | uq | max | |
|---|---|---|---|---|---|---|---|
| 1 | rowTabulates | 1 | 1 | 1 | 1 | 1 | 1 |
Figure: Benchmarking of colTabulates() on 10x1000 data as well as rowTabulates() on the same data transposed. Outliers are displayed as crosses. Times are in milliseconds.
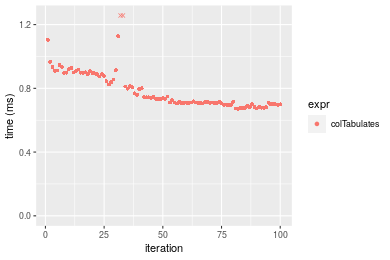
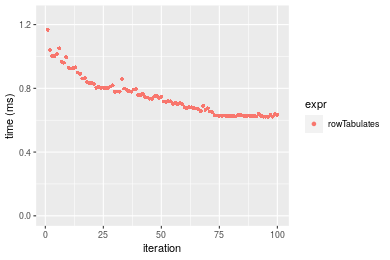 Table: Benchmarking of colTabulates() and rowTabulates() on 10x1000 data (original and transposed). The top panel shows times in milliseconds and the bottom panel shows relative times.
| expr | min | lq | mean | median | uq | max | |
|---|---|---|---|---|---|---|---|
| 2 | rowTabulates | 621.013 | 634.1315 | 750.9423 | 726.829 | 807.0165 | 1167.277 |
| 1 | colTabulates | 671.640 | 705.4600 | 790.4560 | 734.978 | 889.6275 | 1354.405 |
| expr | min | lq | mean | median | uq | max | |
|---|---|---|---|---|---|---|---|
| 2 | rowTabulates | 1.000000 | 1.000000 | 1.000000 | 1.000000 | 1.000000 | 1.000000 |
| 1 | colTabulates | 1.081523 | 1.112482 | 1.052619 | 1.011212 | 1.102366 | 1.160312 |
Figure: Benchmarking of colTabulates() and rowTabulates() on 10x1000 data (original and transposed). Outliers are displayed as crosses. Times are in milliseconds.
100x1000 matrix
> X <- data[["100x1000"]]
> gc()
           used  (Mb) gc trigger  (Mb) max used  (Mb)
Ncells  5312125 283.7    7916910 422.9  7916910 422.9
Vcells 10235291  78.1   33191153 253.3 53339345 407.0
> colStats <- microbenchmark(colTabulates = colTabulates(X, na.rm = FALSE), unit = "ms")
> X <- t(X)
> gc()
           used  (Mb) gc trigger  (Mb) max used  (Mb)
Ncells  5312119 283.7    7916910 422.9  7916910 422.9
Vcells 10285334  78.5   33191153 253.3 53339345 407.0
> rowStats <- microbenchmark(rowTabulates = rowTabulates(X, na.rm = FALSE), unit = "ms")
Table: Benchmarking of colTabulates() on 100x1000 data. The top panel shows times in milliseconds and the bottom panel shows relative times.
| expr | min | lq | mean | median | uq | max | |
|---|---|---|---|---|---|---|---|
| 1 | colTabulates | 3.026318 | 3.303526 | 3.67743 | 3.554111 | 3.846069 | 10.60402 |
| expr | min | lq | mean | median | uq | max | |
|---|---|---|---|---|---|---|---|
| 1 | colTabulates | 1 | 1 | 1 | 1 | 1 | 1 |
Table: Benchmarking of rowTabulates() on 100x1000 data (transposed). The top panel shows times in milliseconds and the bottom panel shows relative times.
| expr | min | lq | mean | median | uq | max | |
|---|---|---|---|---|---|---|---|
| 1 | rowTabulates | 4.224572 | 4.367992 | 4.879611 | 4.714155 | 4.854189 | 15.14541 |
| expr | min | lq | mean | median | uq | max | |
|---|---|---|---|---|---|---|---|
| 1 | rowTabulates | 1 | 1 | 1 | 1 | 1 | 1 |
Figure: Benchmarking of colTabulates() on 100x1000 data as well as rowTabulates() on the same data transposed. Outliers are displayed as crosses. Times are in milliseconds.
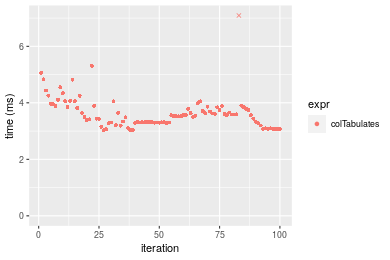
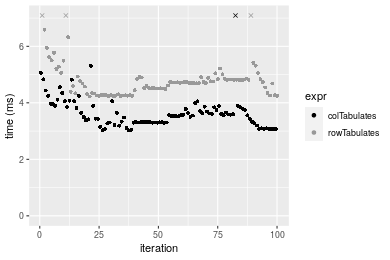
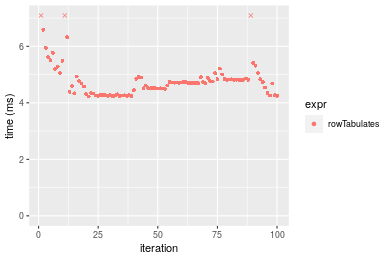 Table: Benchmarking of colTabulates() and rowTabulates() on 100x1000 data (original and transposed). The top panel shows times in milliseconds and the bottom panel shows relative times.
| expr | min | lq | mean | median | uq | max | |
|---|---|---|---|---|---|---|---|
| 1 | colTabulates | 3.026318 | 3.303526 | 3.677430 | 3.554111 | 3.846069 | 10.60402 |
| 2 | rowTabulates | 4.224572 | 4.367992 | 4.879611 | 4.714155 | 4.854189 | 15.14541 |
| expr | min | lq | mean | median | uq | max | |
|---|---|---|---|---|---|---|---|
| 1 | colTabulates | 1.000000 | 1.000000 | 1.000000 | 1.000000 | 1.000000 | 1.000000 |
| 2 | rowTabulates | 1.395944 | 1.322221 | 1.326908 | 1.326395 | 1.262117 | 1.428271 |
Figure: Benchmarking of colTabulates() and rowTabulates() on 100x1000 data (original and transposed). Outliers are displayed as crosses. Times are in milliseconds.
1000x100 matrix
> X <- data[["1000x100"]]
> gc()
           used  (Mb) gc trigger  (Mb) max used  (Mb)
Ncells  5312296 283.8    7916910 422.9  7916910 422.9
Vcells 10235764  78.1   33191153 253.3 53339345 407.0
> colStats <- microbenchmark(colTabulates = colTabulates(X, na.rm = FALSE), unit = "ms")
> X <- t(X)
> gc()
           used  (Mb) gc trigger  (Mb) max used  (Mb)
Ncells  5312290 283.8    7916910 422.9  7916910 422.9
Vcells 10285807  78.5   33191153 253.3 53339345 407.0
> rowStats <- microbenchmark(rowTabulates = rowTabulates(X, na.rm = FALSE), unit = "ms")
Table: Benchmarking of colTabulates() on 1000x100 data. The top panel shows times in milliseconds and the bottom panel shows relative times.
| expr | min | lq | mean | median | uq | max | |
|---|---|---|---|---|---|---|---|
| 1 | colTabulates | 2.946093 | 3.29304 | 3.639855 | 3.408883 | 3.649589 | 13.79837 |
| expr | min | lq | mean | median | uq | max | |
|---|---|---|---|---|---|---|---|
| 1 | colTabulates | 1 | 1 | 1 | 1 | 1 | 1 |
Table: Benchmarking of rowTabulates() on 1000x100 data (transposed). The top panel shows times in milliseconds and the bottom panel shows relative times.
| expr | min | lq | mean | median | uq | max | |
|---|---|---|---|---|---|---|---|
| 1 | rowTabulates | 4.31966 | 4.392578 | 4.865569 | 4.804507 | 4.917851 | 11.91221 |
| expr | min | lq | mean | median | uq | max | |
|---|---|---|---|---|---|---|---|
| 1 | rowTabulates | 1 | 1 | 1 | 1 | 1 | 1 |
Figure: Benchmarking of colTabulates() on 1000x100 data as well as rowTabulates() on the same data transposed. Outliers are displayed as crosses. Times are in milliseconds.
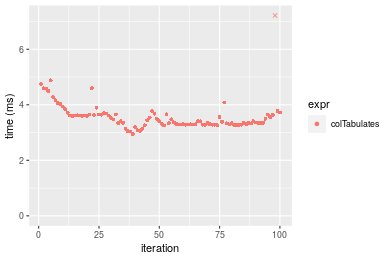
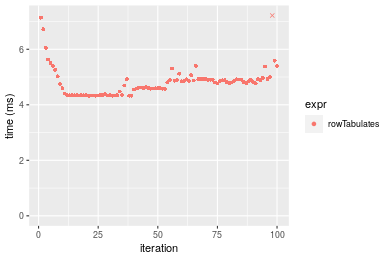 Table: Benchmarking of colTabulates() and rowTabulates() on 1000x100 data (original and transposed). The top panel shows times in milliseconds and the bottom panel shows relative times.
| expr | min | lq | mean | median | uq | max | |
|---|---|---|---|---|---|---|---|
| 1 | colTabulates | 2.946093 | 3.293040 | 3.639855 | 3.408883 | 3.649589 | 13.79837 |
| 2 | rowTabulates | 4.319660 | 4.392578 | 4.865569 | 4.804507 | 4.917851 | 11.91221 |
| expr | min | lq | mean | median | uq | max | |
|---|---|---|---|---|---|---|---|
| 1 | colTabulates | 1.000000 | 1.000000 | 1.000000 | 1.000000 | 1.000000 | 1.0000000 |
| 2 | rowTabulates | 1.466233 | 1.333898 | 1.336748 | 1.409408 | 1.347508 | 0.8633057 |
Figure: Benchmarking of colTabulates() and rowTabulates() on 1000x100 data (original and transposed). Outliers are displayed as crosses. Times are in milliseconds.
Appendix
Session information
R version 4.1.1 Patched (2021-08-10 r80727)
Platform: x86_64-pc-linux-gnu (64-bit)
Running under: Ubuntu 18.04.5 LTS

Matrix products: default
BLAS:   /home/hb/software/R-devel/R-4-1-branch/lib/R/lib/libRblas.so
LAPACK: /home/hb/software/R-devel/R-4-1-branch/lib/R/lib/libRlapack.so

locale:
 [1] LC_CTYPE=en_US.UTF-8       LC_NUMERIC=C
 [3] LC_TIME=en_US.UTF-8        LC_COLLATE=en_US.UTF-8
 [5] LC_MONETARY=en_US.UTF-8    LC_MESSAGES=en_US.UTF-8
 [7] LC_PAPER=en_US.UTF-8       LC_NAME=C
 [9] LC_ADDRESS=C               LC_TELEPHONE=C
[11] LC_MEASUREMENT=en_US.UTF-8 LC_IDENTIFICATION=C

attached base packages:
[1] stats     graphics  grDevices utils     datasets  methods   base

other attached packages:
[1] microbenchmark_1.4-7   matrixStats_0.60.0     ggplot2_3.3.5
[4] knitr_1.33             R.devices_2.17.0       R.utils_2.10.1
[7] R.oo_1.24.0            R.methodsS3_1.8.1-9001 history_0.0.1-9000

loaded via a namespace (and not attached):
 [1] Biobase_2.52.0          httr_1.4.2              splines_4.1.1
 [4] bit64_4.0.5             network_1.17.1          assertthat_0.2.1
 [7] highr_0.9               stats4_4.1.1            blob_1.2.2
[10] GenomeInfoDbData_1.2.6  robustbase_0.93-8       pillar_1.6.2
[13] RSQLite_2.2.8           lattice_0.20-44         glue_1.4.2
[16] digest_0.6.27           XVector_0.32.0          colorspace_2.0-2
[19] Matrix_1.3-4            XML_3.99-0.7            pkgconfig_2.0.3
[22] zlibbioc_1.38.0         genefilter_1.74.0       purrr_0.3.4
[25] ergm_4.1.2              xtable_1.8-4            scales_1.1.1
[28] tibble_3.1.4            annotate_1.70.0         KEGGREST_1.32.0
[31] farver_2.1.0            generics_0.1.0          IRanges_2.26.0
[34] ellipsis_0.3.2          cachem_1.0.6            withr_2.4.2
[37] BiocGenerics_0.38.0     mime_0.11               survival_3.2-13
[40] magrittr_2.0.1          crayon_1.4.1            statnet.common_4.5.0
[43] memoise_2.0.0           laeken_0.5.1            fansi_0.5.0
[46] R.cache_0.15.0          MASS_7.3-54             R.rsp_0.44.0
[49] progressr_0.8.0         tools_4.1.1             lifecycle_1.0.0
[52] S4Vectors_0.30.0        trust_0.1-8             munsell_0.5.0
[55] tabby_0.0.1-9001        AnnotationDbi_1.54.1    Biostrings_2.60.2
[58] compiler_4.1.1          GenomeInfoDb_1.28.1     rlang_0.4.11
[61] grid_4.1.1              RCurl_1.98-1.4          cwhmisc_6.6
[64] rstudioapi_0.13         rappdirs_0.3.3          startup_0.15.0
[67] labeling_0.4.2          bitops_1.0-7            base64enc_0.1-3
[70] boot_1.3-28             gtable_0.3.0            DBI_1.1.1
[73] markdown_1.1            R6_2.5.1                lpSolveAPI_5.5.2.0-17.7
[76] rle_0.9.2               dplyr_1.0.7             fastmap_1.1.0
[79] bit_4.0.4               utf8_1.2.2              parallel_4.1.1
[82] Rcpp_1.0.7              vctrs_0.3.8             png_0.1-7
[85] DEoptimR_1.0-9          tidyselect_1.1.1        xfun_0.25
[88] coda_0.19-4
Total processing time was 14.09 secs.
Reproducibility
To reproduce this report, do:
html <- matrixStats:::benchmark('colTabulates')
Copyright Henrik Bengtsson. Last updated on 2021-08-25 22:30:34 (+0200 UTC). Powered by RSP.