matrixStats.benchmarks
colLogSumExps() and rowLogSumExps() benchmarks on subsetted computation
This report benchmark the performance of colLogSumExps() and rowLogSumExps() on subsetted computation.
Data
> rmatrix <- function(nrow, ncol, mode = c("logical", "double", "integer", "index"), range = c(-100,
+     +100), na_prob = 0) {
+     mode <- match.arg(mode)
+     n <- nrow * ncol
+     if (mode == "logical") {
+         x <- sample(c(FALSE, TRUE), size = n, replace = TRUE)
+     }     else if (mode == "index") {
+         x <- seq_len(n)
+         mode <- "integer"
+     }     else {
+         x <- runif(n, min = range[1], max = range[2])
+     }
+     storage.mode(x) <- mode
+     if (na_prob > 0)
+         x[sample(n, size = na_prob * n)] <- NA
+     dim(x) <- c(nrow, ncol)
+     x
+ }
> rmatrices <- function(scale = 10, seed = 1, ...) {
+     set.seed(seed)
+     data <- list()
+     data[[1]] <- rmatrix(nrow = scale * 1, ncol = scale * 1, ...)
+     data[[2]] <- rmatrix(nrow = scale * 10, ncol = scale * 10, ...)
+     data[[3]] <- rmatrix(nrow = scale * 100, ncol = scale * 1, ...)
+     data[[4]] <- t(data[[3]])
+     data[[5]] <- rmatrix(nrow = scale * 10, ncol = scale * 100, ...)
+     data[[6]] <- t(data[[5]])
+     names(data) <- sapply(data, FUN = function(x) paste(dim(x), collapse = "x"))
+     data
+ }
> data <- rmatrices(mode = "double")
Results
10x10 matrix
> X <- data[["10x10"]]
> rows <- sample.int(nrow(X), size = nrow(X) * 0.7)
> cols <- sample.int(ncol(X), size = ncol(X) * 0.7)
> X_S <- X[rows, cols]
> gc()
           used  (Mb) gc trigger  (Mb) max used  (Mb)
Ncells  5238049 279.8    7916910 422.9  7916910 422.9
Vcells 10108692  77.2   33191153 253.3 53339345 407.0
> colStats <- microbenchmark(colLogSumExps_X_S = colLogSumExps(X_S, na.rm = FALSE), `colLogSumExps(X, rows, cols)` = colLogSumExps(X,
+     rows = rows, cols = cols, na.rm = FALSE), `colLogSumExps(X[rows, cols])` = colLogSumExps(X[rows,
+     cols], na.rm = FALSE), unit = "ms")
> X <- t(X)
> X_S <- t(X_S)
> gc()
           used  (Mb) gc trigger  (Mb) max used  (Mb)
Ncells  5225312 279.1    7916910 422.9  7916910 422.9
Vcells 10066514  76.9   33191153 253.3 53339345 407.0
> rowStats <- microbenchmark(rowLogSumExps_X_S = rowLogSumExps(X_S, na.rm = FALSE), `rowLogSumExps(X, cols, rows)` = rowLogSumExps(X,
+     rows = cols, cols = rows, na.rm = FALSE), `rowLogSumExps(X[cols, rows])` = rowLogSumExps(X[cols,
+     rows], na.rm = FALSE), unit = "ms")
Table: Benchmarking of colLogSumExps_X_S(), colLogSumExps(X, rows, cols)() and colLogSumExps(X[rows, cols])() on 10x10 data. The top panel shows times in milliseconds and the bottom panel shows relative times.
| expr | min | lq | mean | median | uq | max | |
|---|---|---|---|---|---|---|---|
| 1 | colLogSumExps_X_S | 0.007115 | 0.0073195 | 0.0101712 | 0.0074750 | 0.0076295 | 0.236078 |
| 2 | colLogSumExps(X, rows, cols) | 0.007420 | 0.0077625 | 0.0083343 | 0.0079385 | 0.0081360 | 0.021503 |
| 3 | colLogSumExps(X[rows, cols]) | 0.008110 | 0.0087055 | 0.0090248 | 0.0088625 | 0.0090620 | 0.018043 |
| expr | min | lq | mean | median | uq | max | |
|---|---|---|---|---|---|---|---|
| 1 | colLogSumExps_X_S | 1.000000 | 1.000000 | 1.0000000 | 1.000000 | 1.000000 | 1.0000000 |
| 2 | colLogSumExps(X, rows, cols) | 1.042867 | 1.060523 | 0.8194032 | 1.062007 | 1.066387 | 0.0910843 |
| 3 | colLogSumExps(X[rows, cols]) | 1.139845 | 1.189357 | 0.8872928 | 1.185619 | 1.187758 | 0.0764281 |
Table: Benchmarking of rowLogSumExps_X_S(), rowLogSumExps(X, cols, rows)() and rowLogSumExps(X[cols, rows])() on 10x10 data (transposed). The top panel shows times in milliseconds and the bottom panel shows relative times.
| expr | min | lq | mean | median | uq | max | |
|---|---|---|---|---|---|---|---|
| 1 | rowLogSumExps_X_S | 0.005605 | 0.005921 | 0.0062526 | 0.0060105 | 0.0061855 | 0.019133 |
| 2 | rowLogSumExps(X, cols, rows) | 0.006106 | 0.006320 | 0.0084117 | 0.0064450 | 0.0066540 | 0.181226 |
| 3 | rowLogSumExps(X[cols, rows]) | 0.006688 | 0.007062 | 0.0079129 | 0.0072195 | 0.0074580 | 0.020867 |
| expr | min | lq | mean | median | uq | max | |
|---|---|---|---|---|---|---|---|
| 1 | rowLogSumExps_X_S | 1.000000 | 1.000000 | 1.000000 | 1.000000 | 1.000000 | 1.000000 |
| 2 | rowLogSumExps(X, cols, rows) | 1.089384 | 1.067387 | 1.345314 | 1.072290 | 1.075742 | 9.471907 |
| 3 | rowLogSumExps(X[cols, rows]) | 1.193220 | 1.192704 | 1.265544 | 1.201148 | 1.205723 | 1.090629 |
Figure: Benchmarking of colLogSumExps_X_S(), colLogSumExps(X, rows, cols)() and colLogSumExps(X[rows, cols])() on 10x10 data as well as rowLogSumExps_X_S(), rowLogSumExps(X, cols, rows)() and rowLogSumExps(X[cols, rows])() on the same data transposed. Outliers are displayed as crosses. Times are in milliseconds.
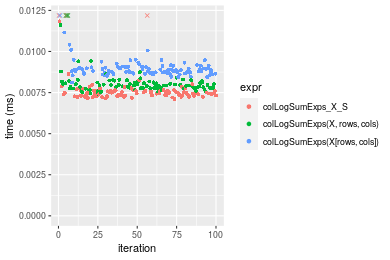
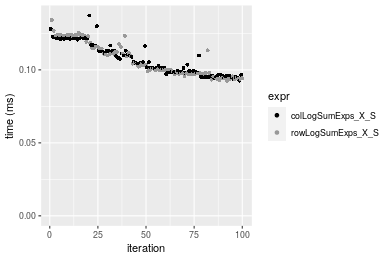
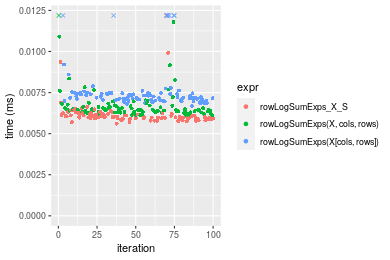 Table: Benchmarking of colLogSumExps_X_S() and rowLogSumExps_X_S() on 10x10 data (original and transposed). The top panel shows times in milliseconds and the bottom panel shows relative times.
| expr | min | lq | mean | median | uq | max | |
|---|---|---|---|---|---|---|---|
| 2 | rowLogSumExps_X_S | 5.605 | 5.9210 | 6.25260 | 6.0105 | 6.1855 | 19.133 |
| 1 | colLogSumExps_X_S | 7.115 | 7.3195 | 10.17122 | 7.4750 | 7.6295 | 236.078 |
| expr | min | lq | mean | median | uq | max | |
|---|---|---|---|---|---|---|---|
| 2 | rowLogSumExps_X_S | 1.000000 | 1.000000 | 1.000000 | 1.000000 | 1.000000 | 1.00000 |
| 1 | colLogSumExps_X_S | 1.269402 | 1.236193 | 1.626718 | 1.243657 | 1.233449 | 12.33879 |
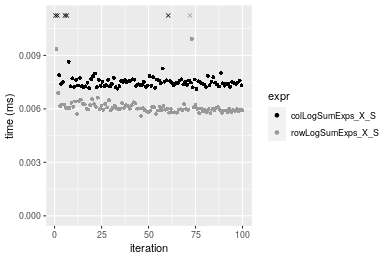
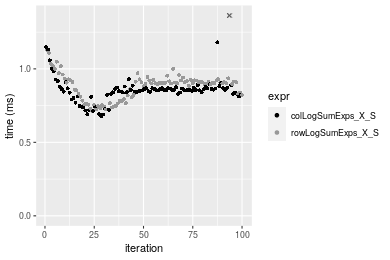
Figure: Benchmarking of colLogSumExps_X_S() and rowLogSumExps_X_S() on 10x10 data (original and transposed). Outliers are displayed as crosses. Times are in milliseconds.
100x100 matrix
> X <- data[["100x100"]]
> rows <- sample.int(nrow(X), size = nrow(X) * 0.7)
> cols <- sample.int(ncol(X), size = ncol(X) * 0.7)
> X_S <- X[rows, cols]
> gc()
          used  (Mb) gc trigger  (Mb) max used  (Mb)
Ncells 5224037 279.0    7916910 422.9  7916910 422.9
Vcells 9737400  74.3   33191153 253.3 53339345 407.0
> colStats <- microbenchmark(colLogSumExps_X_S = colLogSumExps(X_S, na.rm = FALSE), `colLogSumExps(X, rows, cols)` = colLogSumExps(X,
+     rows = rows, cols = cols, na.rm = FALSE), `colLogSumExps(X[rows, cols])` = colLogSumExps(X[rows,
+     cols], na.rm = FALSE), unit = "ms")
> X <- t(X)
> X_S <- t(X_S)
> gc()
          used  (Mb) gc trigger  (Mb) max used  (Mb)
Ncells 5224031 279.0    7916910 422.9  7916910 422.9
Vcells 9747483  74.4   33191153 253.3 53339345 407.0
> rowStats <- microbenchmark(rowLogSumExps_X_S = rowLogSumExps(X_S, na.rm = FALSE), `rowLogSumExps(X, cols, rows)` = rowLogSumExps(X,
+     rows = cols, cols = rows, na.rm = FALSE), `rowLogSumExps(X[cols, rows])` = rowLogSumExps(X[cols,
+     rows], na.rm = FALSE), unit = "ms")
Table: Benchmarking of colLogSumExps_X_S(), colLogSumExps(X, rows, cols)() and colLogSumExps(X[rows, cols])() on 100x100 data. The top panel shows times in milliseconds and the bottom panel shows relative times.
| expr | min | lq | mean | median | uq | max | |
|---|---|---|---|---|---|---|---|
| 1 | colLogSumExps_X_S | 0.092659 | 0.0982260 | 0.1071898 | 0.1045055 | 0.1167345 | 0.137236 |
| 2 | colLogSumExps(X, rows, cols) | 0.104962 | 0.1109100 | 0.1214687 | 0.1166815 | 0.1329395 | 0.164765 |
| 3 | colLogSumExps(X[rows, cols]) | 0.105212 | 0.1115215 | 0.1222706 | 0.1174300 | 0.1334405 | 0.189864 |
| expr | min | lq | mean | median | uq | max | |
|---|---|---|---|---|---|---|---|
| 1 | colLogSumExps_X_S | 1.000000 | 1.000000 | 1.000000 | 1.000000 | 1.000000 | 1.000000 |
| 2 | colLogSumExps(X, rows, cols) | 1.132777 | 1.129131 | 1.133212 | 1.116511 | 1.138819 | 1.200596 |
| 3 | colLogSumExps(X[rows, cols]) | 1.135475 | 1.135356 | 1.140693 | 1.123673 | 1.143111 | 1.383485 |
Table: Benchmarking of rowLogSumExps_X_S(), rowLogSumExps(X, cols, rows)() and rowLogSumExps(X[cols, rows])() on 100x100 data (transposed). The top panel shows times in milliseconds and the bottom panel shows relative times.
| expr | min | lq | mean | median | uq | max | |
|---|---|---|---|---|---|---|---|
| 1 | rowLogSumExps_X_S | 0.092408 | 0.097453 | 0.1067365 | 0.1025205 | 0.1155995 | 0.134108 |
| 2 | rowLogSumExps(X, cols, rows) | 0.100721 | 0.107351 | 0.1175832 | 0.1146055 | 0.1246125 | 0.178518 |
| 3 | rowLogSumExps(X[cols, rows]) | 0.105402 | 0.110651 | 0.1206870 | 0.1169775 | 0.1279125 | 0.163867 |
| expr | min | lq | mean | median | uq | max | |
|---|---|---|---|---|---|---|---|
| 1 | rowLogSumExps_X_S | 1.000000 | 1.000000 | 1.000000 | 1.000000 | 1.000000 | 1.000000 |
| 2 | rowLogSumExps(X, cols, rows) | 1.089960 | 1.101567 | 1.101621 | 1.117879 | 1.077967 | 1.331151 |
| 3 | rowLogSumExps(X[cols, rows]) | 1.140616 | 1.135429 | 1.130700 | 1.141016 | 1.106514 | 1.221903 |
Figure: Benchmarking of colLogSumExps_X_S(), colLogSumExps(X, rows, cols)() and colLogSumExps(X[rows, cols])() on 100x100 data as well as rowLogSumExps_X_S(), rowLogSumExps(X, cols, rows)() and rowLogSumExps(X[cols, rows])() on the same data transposed. Outliers are displayed as crosses. Times are in milliseconds.

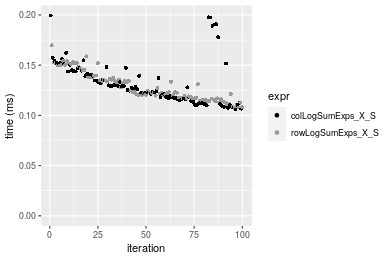
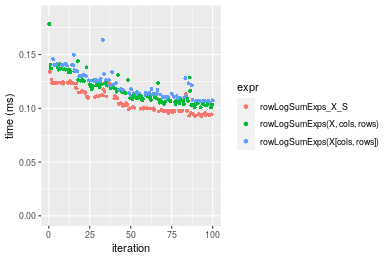 Table: Benchmarking of colLogSumExps_X_S() and rowLogSumExps_X_S() on 100x100 data (original and transposed). The top panel shows times in milliseconds and the bottom panel shows relative times.
| expr | min | lq | mean | median | uq | max | |
|---|---|---|---|---|---|---|---|
| 2 | rowLogSumExps_X_S | 92.408 | 97.453 | 106.7365 | 102.5205 | 115.5995 | 134.108 |
| 1 | colLogSumExps_X_S | 92.659 | 98.226 | 107.1898 | 104.5055 | 116.7345 | 137.236 |
| expr | min | lq | mean | median | uq | max | |
|---|---|---|---|---|---|---|---|
| 2 | rowLogSumExps_X_S | 1.000000 | 1.000000 | 1.000000 | 1.000000 | 1.000000 | 1.000000 |
| 1 | colLogSumExps_X_S | 1.002716 | 1.007932 | 1.004247 | 1.019362 | 1.009818 | 1.023324 |
Figure: Benchmarking of colLogSumExps_X_S() and rowLogSumExps_X_S() on 100x100 data (original and transposed). Outliers are displayed as crosses. Times are in milliseconds.
1000x10 matrix
> X <- data[["1000x10"]]
> rows <- sample.int(nrow(X), size = nrow(X) * 0.7)
> cols <- sample.int(ncol(X), size = ncol(X) * 0.7)
> X_S <- X[rows, cols]
> gc()
          used  (Mb) gc trigger  (Mb) max used  (Mb)
Ncells 5224778 279.1    7916910 422.9  7916910 422.9
Vcells 9741449  74.4   33191153 253.3 53339345 407.0
> colStats <- microbenchmark(colLogSumExps_X_S = colLogSumExps(X_S, na.rm = FALSE), `colLogSumExps(X, rows, cols)` = colLogSumExps(X,
+     rows = rows, cols = cols, na.rm = FALSE), `colLogSumExps(X[rows, cols])` = colLogSumExps(X[rows,
+     cols], na.rm = FALSE), unit = "ms")
> X <- t(X)
> X_S <- t(X_S)
> gc()
          used  (Mb) gc trigger  (Mb) max used  (Mb)
Ncells 5224772 279.1    7916910 422.9  7916910 422.9
Vcells 9751532  74.4   33191153 253.3 53339345 407.0
> rowStats <- microbenchmark(rowLogSumExps_X_S = rowLogSumExps(X_S, na.rm = FALSE), `rowLogSumExps(X, cols, rows)` = rowLogSumExps(X,
+     rows = cols, cols = rows, na.rm = FALSE), `rowLogSumExps(X[cols, rows])` = rowLogSumExps(X[cols,
+     rows], na.rm = FALSE), unit = "ms")
Table: Benchmarking of colLogSumExps_X_S(), colLogSumExps(X, rows, cols)() and colLogSumExps(X[rows, cols])() on 1000x10 data. The top panel shows times in milliseconds and the bottom panel shows relative times.
| expr | min | lq | mean | median | uq | max | |
|---|---|---|---|---|---|---|---|
| 1 | colLogSumExps_X_S | 0.081337 | 0.0878975 | 0.0918830 | 0.0917245 | 0.0936210 | 0.134037 |
| 3 | colLogSumExps(X[rows, cols]) | 0.090477 | 0.0974915 | 0.1047085 | 0.1023490 | 0.1074920 | 0.166081 |
| 2 | colLogSumExps(X, rows, cols) | 0.091705 | 0.1020535 | 0.1065506 | 0.1056700 | 0.1096165 | 0.132534 |
| expr | min | lq | mean | median | uq | max | |
|---|---|---|---|---|---|---|---|
| 1 | colLogSumExps_X_S | 1.000000 | 1.000000 | 1.000000 | 1.000000 | 1.000000 | 1.0000000 |
| 3 | colLogSumExps(X[rows, cols]) | 1.112372 | 1.109150 | 1.139585 | 1.115831 | 1.148161 | 1.2390683 |
| 2 | colLogSumExps(X, rows, cols) | 1.127470 | 1.161051 | 1.159633 | 1.152037 | 1.170854 | 0.9887867 |
Table: Benchmarking of rowLogSumExps_X_S(), rowLogSumExps(X, cols, rows)() and rowLogSumExps(X[cols, rows])() on 1000x10 data (transposed). The top panel shows times in milliseconds and the bottom panel shows relative times.
| expr | min | lq | mean | median | uq | max | |
|---|---|---|---|---|---|---|---|
| 1 | rowLogSumExps_X_S | 0.089144 | 0.0936680 | 0.1016918 | 0.0985455 | 0.1077120 | 0.134465 |
| 2 | rowLogSumExps(X, cols, rows) | 0.095979 | 0.1018065 | 0.1105511 | 0.1076820 | 0.1195335 | 0.140813 |
| 3 | rowLogSumExps(X[cols, rows]) | 0.105246 | 0.1092500 | 0.1196410 | 0.1164450 | 0.1283870 | 0.210126 |
| expr | min | lq | mean | median | uq | max | |
|---|---|---|---|---|---|---|---|
| 1 | rowLogSumExps_X_S | 1.000000 | 1.000000 | 1.000000 | 1.000000 | 1.000000 | 1.000000 |
| 2 | rowLogSumExps(X, cols, rows) | 1.076674 | 1.086887 | 1.087119 | 1.092713 | 1.109751 | 1.047209 |
| 3 | rowLogSumExps(X[cols, rows]) | 1.180629 | 1.166354 | 1.176506 | 1.181637 | 1.191947 | 1.562682 |
Figure: Benchmarking of colLogSumExps_X_S(), colLogSumExps(X, rows, cols)() and colLogSumExps(X[rows, cols])() on 1000x10 data as well as rowLogSumExps_X_S(), rowLogSumExps(X, cols, rows)() and rowLogSumExps(X[cols, rows])() on the same data transposed. Outliers are displayed as crosses. Times are in milliseconds.
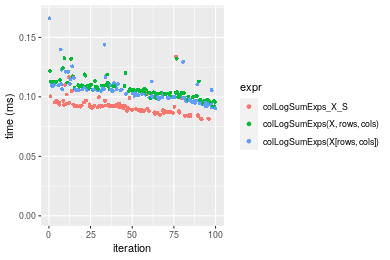
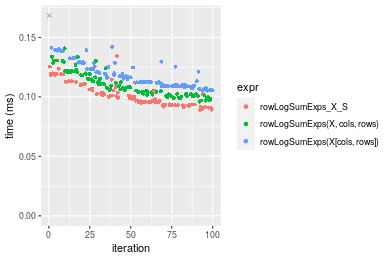 Table: Benchmarking of colLogSumExps_X_S() and rowLogSumExps_X_S() on 1000x10 data (original and transposed). The top panel shows times in milliseconds and the bottom panel shows relative times.
| expr | min | lq | mean | median | uq | max | |
|---|---|---|---|---|---|---|---|
| 1 | colLogSumExps_X_S | 81.337 | 87.8975 | 91.88296 | 91.7245 | 93.621 | 134.037 |
| 2 | rowLogSumExps_X_S | 89.144 | 93.6680 | 101.69176 | 98.5455 | 107.712 | 134.465 |
| expr | min | lq | mean | median | uq | max | |
|---|---|---|---|---|---|---|---|
| 1 | colLogSumExps_X_S | 1.000000 | 1.00000 | 1.000000 | 1.000000 | 1.000000 | 1.000000 |
| 2 | rowLogSumExps_X_S | 1.095983 | 1.06565 | 1.106753 | 1.074364 | 1.150511 | 1.003193 |
Figure: Benchmarking of colLogSumExps_X_S() and rowLogSumExps_X_S() on 1000x10 data (original and transposed). Outliers are displayed as crosses. Times are in milliseconds.
10x1000 matrix
> X <- data[["10x1000"]]
> rows <- sample.int(nrow(X), size = nrow(X) * 0.7)
> cols <- sample.int(ncol(X), size = ncol(X) * 0.7)
> X_S <- X[rows, cols]
> gc()
          used  (Mb) gc trigger  (Mb) max used  (Mb)
Ncells 5224982 279.1    7916910 422.9  7916910 422.9
Vcells 9742375  74.4   33191153 253.3 53339345 407.0
> colStats <- microbenchmark(colLogSumExps_X_S = colLogSumExps(X_S, na.rm = FALSE), `colLogSumExps(X, rows, cols)` = colLogSumExps(X,
+     rows = rows, cols = cols, na.rm = FALSE), `colLogSumExps(X[rows, cols])` = colLogSumExps(X[rows,
+     cols], na.rm = FALSE), unit = "ms")
> X <- t(X)
> X_S <- t(X_S)
> gc()
          used  (Mb) gc trigger  (Mb) max used  (Mb)
Ncells 5224976 279.1    7916910 422.9  7916910 422.9
Vcells 9752458  74.5   33191153 253.3 53339345 407.0
> rowStats <- microbenchmark(rowLogSumExps_X_S = rowLogSumExps(X_S, na.rm = FALSE), `rowLogSumExps(X, cols, rows)` = rowLogSumExps(X,
+     rows = cols, cols = rows, na.rm = FALSE), `rowLogSumExps(X[cols, rows])` = rowLogSumExps(X[cols,
+     rows], na.rm = FALSE), unit = "ms")
Table: Benchmarking of colLogSumExps_X_S(), colLogSumExps(X, rows, cols)() and colLogSumExps(X[rows, cols])() on 10x1000 data. The top panel shows times in milliseconds and the bottom panel shows relative times.
| expr | min | lq | mean | median | uq | max | |
|---|---|---|---|---|---|---|---|
| 1 | colLogSumExps_X_S | 0.105838 | 0.1169940 | 0.1325966 | 0.1280575 | 0.1437870 | 0.199453 |
| 3 | colLogSumExps(X[rows, cols]) | 0.121829 | 0.1324750 | 0.1430677 | 0.1380670 | 0.1509265 | 0.210831 |
| 2 | colLogSumExps(X, rows, cols) | 0.119458 | 0.1310025 | 0.1445732 | 0.1394405 | 0.1508250 | 0.214062 |
| expr | min | lq | mean | median | uq | max | |
|---|---|---|---|---|---|---|---|
| 1 | colLogSumExps_X_S | 1.000000 | 1.000000 | 1.000000 | 1.000000 | 1.000000 | 1.000000 |
| 3 | colLogSumExps(X[rows, cols]) | 1.151089 | 1.132323 | 1.078969 | 1.078164 | 1.049653 | 1.057046 |
| 2 | colLogSumExps(X, rows, cols) | 1.128687 | 1.119737 | 1.090323 | 1.088890 | 1.048947 | 1.073245 |
Table: Benchmarking of rowLogSumExps_X_S(), rowLogSumExps(X, cols, rows)() and rowLogSumExps(X[cols, rows])() on 10x1000 data (transposed). The top panel shows times in milliseconds and the bottom panel shows relative times.
| expr | min | lq | mean | median | uq | max | |
|---|---|---|---|---|---|---|---|
| 1 | rowLogSumExps_X_S | 0.107426 | 0.1172715 | 0.1286174 | 0.1229725 | 0.1376535 | 0.169853 |
| 3 | rowLogSumExps(X[cols, rows]) | 0.116121 | 0.1300935 | 0.1426984 | 0.1354825 | 0.1564030 | 0.179422 |
| 2 | rowLogSumExps(X, cols, rows) | 0.119500 | 0.1299565 | 0.1421029 | 0.1384615 | 0.1486940 | 0.214896 |
| expr | min | lq | mean | median | uq | max | |
|---|---|---|---|---|---|---|---|
| 1 | rowLogSumExps_X_S | 1.000000 | 1.000000 | 1.00000 | 1.000000 | 1.000000 | 1.000000 |
| 3 | rowLogSumExps(X[cols, rows]) | 1.080939 | 1.109336 | 1.10948 | 1.101730 | 1.136208 | 1.056337 |
| 2 | rowLogSumExps(X, cols, rows) | 1.112394 | 1.108168 | 1.10485 | 1.125955 | 1.080205 | 1.265188 |
Figure: Benchmarking of colLogSumExps_X_S(), colLogSumExps(X, rows, cols)() and colLogSumExps(X[rows, cols])() on 10x1000 data as well as rowLogSumExps_X_S(), rowLogSumExps(X, cols, rows)() and rowLogSumExps(X[cols, rows])() on the same data transposed. Outliers are displayed as crosses. Times are in milliseconds.
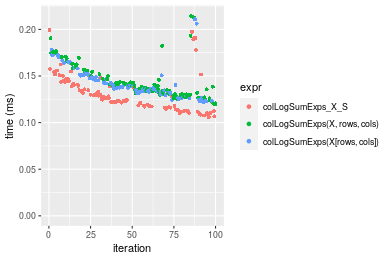
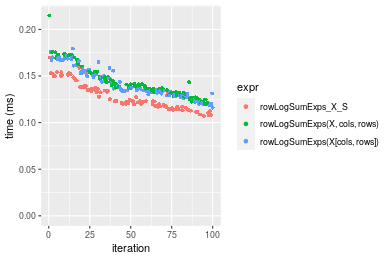 Table: Benchmarking of colLogSumExps_X_S() and rowLogSumExps_X_S() on 10x1000 data (original and transposed). The top panel shows times in milliseconds and the bottom panel shows relative times.
| expr | min | lq | mean | median | uq | max | |
|---|---|---|---|---|---|---|---|
| 2 | rowLogSumExps_X_S | 107.426 | 117.2715 | 128.6174 | 122.9725 | 137.6535 | 169.853 |
| 1 | colLogSumExps_X_S | 105.838 | 116.9940 | 132.5966 | 128.0575 | 143.7870 | 199.453 |
| expr | min | lq | mean | median | uq | max | |
|---|---|---|---|---|---|---|---|
| 2 | rowLogSumExps_X_S | 1.0000000 | 1.0000000 | 1.000000 | 1.000000 | 1.000000 | 1.000000 |
| 1 | colLogSumExps_X_S | 0.9852177 | 0.9976337 | 1.030938 | 1.041351 | 1.044558 | 1.174268 |
Figure: Benchmarking of colLogSumExps_X_S() and rowLogSumExps_X_S() on 10x1000 data (original and transposed). Outliers are displayed as crosses. Times are in milliseconds.
100x1000 matrix
> X <- data[["100x1000"]]
> rows <- sample.int(nrow(X), size = nrow(X) * 0.7)
> cols <- sample.int(ncol(X), size = ncol(X) * 0.7)
> X_S <- X[rows, cols]
> gc()
          used  (Mb) gc trigger  (Mb) max used  (Mb)
Ncells 5225195 279.1    7916910 422.9  7916910 422.9
Vcells 9787108  74.7   33191153 253.3 53339345 407.0
> colStats <- microbenchmark(colLogSumExps_X_S = colLogSumExps(X_S, na.rm = FALSE), `colLogSumExps(X, rows, cols)` = colLogSumExps(X,
+     rows = rows, cols = cols, na.rm = FALSE), `colLogSumExps(X[rows, cols])` = colLogSumExps(X[rows,
+     cols], na.rm = FALSE), unit = "ms")
> X <- t(X)
> X_S <- t(X_S)
> gc()
          used  (Mb) gc trigger  (Mb) max used  (Mb)
Ncells 5225189 279.1    7916910 422.9  7916910 422.9
Vcells 9887191  75.5   33191153 253.3 53339345 407.0
> rowStats <- microbenchmark(rowLogSumExps_X_S = rowLogSumExps(X_S, na.rm = FALSE), `rowLogSumExps(X, cols, rows)` = rowLogSumExps(X,
+     rows = cols, cols = rows, na.rm = FALSE), `rowLogSumExps(X[cols, rows])` = rowLogSumExps(X[cols,
+     rows], na.rm = FALSE), unit = "ms")
Table: Benchmarking of colLogSumExps_X_S(), colLogSumExps(X, rows, cols)() and colLogSumExps(X[rows, cols])() on 100x1000 data. The top panel shows times in milliseconds and the bottom panel shows relative times.
| expr | min | lq | mean | median | uq | max | |
|---|---|---|---|---|---|---|---|
| 1 | colLogSumExps_X_S | 0.732019 | 0.8122615 | 0.8815236 | 0.908237 | 0.931889 | 1.290778 |
| 3 | colLogSumExps(X[rows, cols]) | 0.824849 | 0.9041215 | 1.1203326 | 1.052028 | 1.148853 | 9.666148 |
| 2 | colLogSumExps(X, rows, cols) | 0.823153 | 0.9286710 | 1.0548352 | 1.101485 | 1.165216 | 1.408639 |
| expr | min | lq | mean | median | uq | max | |
|---|---|---|---|---|---|---|---|
| 1 | colLogSumExps_X_S | 1.000000 | 1.000000 | 1.000000 | 1.000000 | 1.000000 | 1.000000 |
| 3 | colLogSumExps(X[rows, cols]) | 1.126814 | 1.113092 | 1.270905 | 1.158319 | 1.232821 | 7.488622 |
| 2 | colLogSumExps(X, rows, cols) | 1.124497 | 1.143315 | 1.196605 | 1.212773 | 1.250381 | 1.091310 |
Table: Benchmarking of rowLogSumExps_X_S(), rowLogSumExps(X, cols, rows)() and rowLogSumExps(X[cols, rows])() on 100x1000 data (transposed). The top panel shows times in milliseconds and the bottom panel shows relative times.
| expr | min | lq | mean | median | uq | max | |
|---|---|---|---|---|---|---|---|
| 1 | rowLogSumExps_X_S | 0.763864 | 0.8275575 | 1.010433 | 0.9387495 | 0.9760135 | 9.037269 |
| 3 | rowLogSumExps(X[cols, rows]) | 0.864047 | 0.9813495 | 1.105827 | 1.1447305 | 1.1737865 | 1.552095 |
| 2 | rowLogSumExps(X, cols, rows) | 0.886787 | 1.0083610 | 1.112867 | 1.1510915 | 1.1868720 | 1.548171 |
| expr | min | lq | mean | median | uq | max | |
|---|---|---|---|---|---|---|---|
| 1 | rowLogSumExps_X_S | 1.000000 | 1.000000 | 1.000000 | 1.000000 | 1.000000 | 1.0000000 |
| 3 | rowLogSumExps(X[cols, rows]) | 1.131153 | 1.185838 | 1.094408 | 1.219421 | 1.202633 | 0.1717438 |
| 2 | rowLogSumExps(X, cols, rows) | 1.160923 | 1.218479 | 1.101376 | 1.226197 | 1.216041 | 0.1713096 |
Figure: Benchmarking of colLogSumExps_X_S(), colLogSumExps(X, rows, cols)() and colLogSumExps(X[rows, cols])() on 100x1000 data as well as rowLogSumExps_X_S(), rowLogSumExps(X, cols, rows)() and rowLogSumExps(X[cols, rows])() on the same data transposed. Outliers are displayed as crosses. Times are in milliseconds.
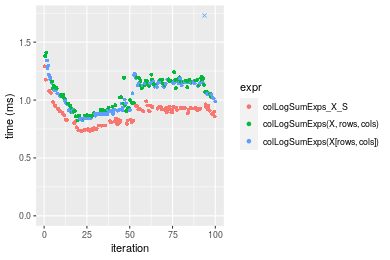
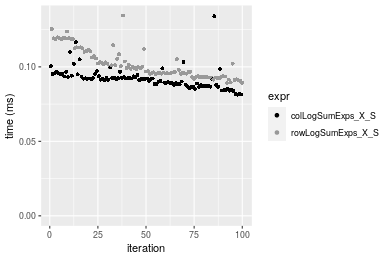
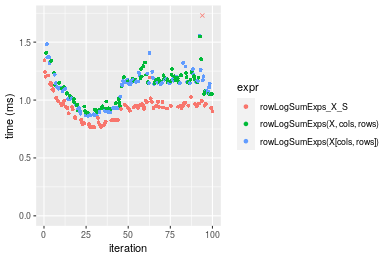 Table: Benchmarking of colLogSumExps_X_S() and rowLogSumExps_X_S() on 100x1000 data (original and transposed). The top panel shows times in milliseconds and the bottom panel shows relative times.
| expr | min | lq | mean | median | uq | max | |
|---|---|---|---|---|---|---|---|
| 1 | colLogSumExps_X_S | 732.019 | 812.2615 | 881.5236 | 908.2370 | 931.8890 | 1290.778 |
| 2 | rowLogSumExps_X_S | 763.864 | 827.5575 | 1010.4334 | 938.7495 | 976.0135 | 9037.269 |
| expr | min | lq | mean | median | uq | max | |
|---|---|---|---|---|---|---|---|
| 1 | colLogSumExps_X_S | 1.000000 | 1.000000 | 1.000000 | 1.000000 | 1.000000 | 1.000000 |
| 2 | rowLogSumExps_X_S | 1.043503 | 1.018831 | 1.146235 | 1.033595 | 1.047349 | 7.001412 |
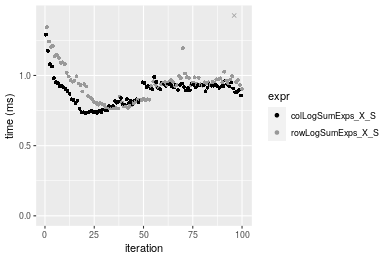
Figure: Benchmarking of colLogSumExps_X_S() and rowLogSumExps_X_S() on 100x1000 data (original and transposed). Outliers are displayed as crosses. Times are in milliseconds.
1000x100 matrix
> X <- data[["1000x100"]]
> rows <- sample.int(nrow(X), size = nrow(X) * 0.7)
> cols <- sample.int(ncol(X), size = ncol(X) * 0.7)
> X_S <- X[rows, cols]
> gc()
          used  (Mb) gc trigger  (Mb) max used  (Mb)
Ncells 5225405 279.1    7916910 422.9  7916910 422.9
Vcells 9787933  74.7   33191153 253.3 53339345 407.0
> colStats <- microbenchmark(colLogSumExps_X_S = colLogSumExps(X_S, na.rm = FALSE), `colLogSumExps(X, rows, cols)` = colLogSumExps(X,
+     rows = rows, cols = cols, na.rm = FALSE), `colLogSumExps(X[rows, cols])` = colLogSumExps(X[rows,
+     cols], na.rm = FALSE), unit = "ms")
> X <- t(X)
> X_S <- t(X_S)
> gc()
          used  (Mb) gc trigger  (Mb) max used  (Mb)
Ncells 5225399 279.1    7916910 422.9  7916910 422.9
Vcells 9888016  75.5   33191153 253.3 53339345 407.0
> rowStats <- microbenchmark(rowLogSumExps_X_S = rowLogSumExps(X_S, na.rm = FALSE), `rowLogSumExps(X, cols, rows)` = rowLogSumExps(X,
+     rows = cols, cols = rows, na.rm = FALSE), `rowLogSumExps(X[cols, rows])` = rowLogSumExps(X[cols,
+     rows], na.rm = FALSE), unit = "ms")
Table: Benchmarking of colLogSumExps_X_S(), colLogSumExps(X, rows, cols)() and colLogSumExps(X[rows, cols])() on 1000x100 data. The top panel shows times in milliseconds and the bottom panel shows relative times.
| expr | min | lq | mean | median | uq | max | |
|---|---|---|---|---|---|---|---|
| 1 | colLogSumExps_X_S | 0.678350 | 0.8307220 | 0.9314281 | 0.855903 | 0.8693755 | 8.881709 |
| 3 | colLogSumExps(X[rows, cols]) | 0.782717 | 0.8763665 | 0.9949185 | 1.027352 | 1.0821845 | 1.706902 |
| 2 | colLogSumExps(X, rows, cols) | 0.810869 | 0.9047975 | 1.0430200 | 1.100774 | 1.1264285 | 1.288961 |
| expr | min | lq | mean | median | uq | max | |
|---|---|---|---|---|---|---|---|
| 1 | colLogSumExps_X_S | 1.000000 | 1.000000 | 1.000000 | 1.000000 | 1.000000 | 1.0000000 |
| 3 | colLogSumExps(X[rows, cols]) | 1.153854 | 1.054946 | 1.068165 | 1.200314 | 1.244784 | 0.1921817 |
| 2 | colLogSumExps(X, rows, cols) | 1.195355 | 1.089170 | 1.119807 | 1.286097 | 1.295675 | 0.1451253 |
Table: Benchmarking of rowLogSumExps_X_S(), rowLogSumExps(X, cols, rows)() and rowLogSumExps(X[cols, rows])() on 1000x100 data (transposed). The top panel shows times in milliseconds and the bottom panel shows relative times.
| expr | min | lq | mean | median | uq | max | |
|---|---|---|---|---|---|---|---|
| 1 | rowLogSumExps_X_S | 0.714063 | 0.8154905 | 0.9628592 | 0.903113 | 0.9221925 | 9.277656 |
| 2 | rowLogSumExps(X, cols, rows) | 0.824174 | 0.9135890 | 1.0372638 | 1.095503 | 1.1237030 | 1.350762 |
| 3 | rowLogSumExps(X[cols, rows]) | 0.827792 | 0.9571870 | 1.0576103 | 1.106101 | 1.1349945 | 1.556035 |
| expr | min | lq | mean | median | uq | max | |
|---|---|---|---|---|---|---|---|
| 1 | rowLogSumExps_X_S | 1.000000 | 1.000000 | 1.000000 | 1.000000 | 1.000000 | 1.0000000 |
| 2 | rowLogSumExps(X, cols, rows) | 1.154203 | 1.120294 | 1.077275 | 1.213029 | 1.218512 | 0.1455930 |
| 3 | rowLogSumExps(X[cols, rows]) | 1.159270 | 1.173756 | 1.098406 | 1.224765 | 1.230757 | 0.1677185 |
Figure: Benchmarking of colLogSumExps_X_S(), colLogSumExps(X, rows, cols)() and colLogSumExps(X[rows, cols])() on 1000x100 data as well as rowLogSumExps_X_S(), rowLogSumExps(X, cols, rows)() and rowLogSumExps(X[cols, rows])() on the same data transposed. Outliers are displayed as crosses. Times are in milliseconds.
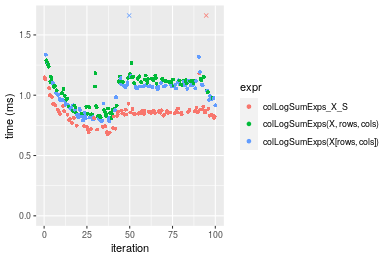
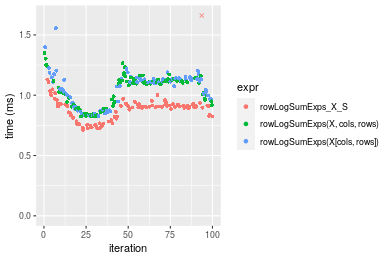 Table: Benchmarking of colLogSumExps_X_S() and rowLogSumExps_X_S() on 1000x100 data (original and transposed). The top panel shows times in milliseconds and the bottom panel shows relative times.
| expr | min | lq | mean | median | uq | max | |
|---|---|---|---|---|---|---|---|
| 1 | colLogSumExps_X_S | 678.350 | 830.7220 | 931.4281 | 855.903 | 869.3755 | 8881.709 |
| 2 | rowLogSumExps_X_S | 714.063 | 815.4905 | 962.8592 | 903.113 | 922.1925 | 9277.656 |
| expr | min | lq | mean | median | uq | max | |
|---|---|---|---|---|---|---|---|
| 1 | colLogSumExps_X_S | 1.000000 | 1.0000000 | 1.000000 | 1.000000 | 1.000000 | 1.00000 |
| 2 | rowLogSumExps_X_S | 1.052647 | 0.9816647 | 1.033745 | 1.055158 | 1.060753 | 1.04458 |
Figure: Benchmarking of colLogSumExps_X_S() and rowLogSumExps_X_S() on 1000x100 data (original and transposed). Outliers are displayed as crosses. Times are in milliseconds.
Appendix
Session information
R version 4.1.1 Patched (2021-08-10 r80727)
Platform: x86_64-pc-linux-gnu (64-bit)
Running under: Ubuntu 18.04.5 LTS

Matrix products: default
BLAS:   /home/hb/software/R-devel/R-4-1-branch/lib/R/lib/libRblas.so
LAPACK: /home/hb/software/R-devel/R-4-1-branch/lib/R/lib/libRlapack.so

locale:
 [1] LC_CTYPE=en_US.UTF-8       LC_NUMERIC=C
 [3] LC_TIME=en_US.UTF-8        LC_COLLATE=en_US.UTF-8
 [5] LC_MONETARY=en_US.UTF-8    LC_MESSAGES=en_US.UTF-8
 [7] LC_PAPER=en_US.UTF-8       LC_NAME=C
 [9] LC_ADDRESS=C               LC_TELEPHONE=C
[11] LC_MEASUREMENT=en_US.UTF-8 LC_IDENTIFICATION=C

attached base packages:
[1] stats     graphics  grDevices utils     datasets  methods   base

other attached packages:
[1] microbenchmark_1.4-7   matrixStats_0.60.0     ggplot2_3.3.5
[4] knitr_1.33             R.devices_2.17.0       R.utils_2.10.1
[7] R.oo_1.24.0            R.methodsS3_1.8.1-9001 history_0.0.1-9000

loaded via a namespace (and not attached):
 [1] Biobase_2.52.0          httr_1.4.2              splines_4.1.1
 [4] bit64_4.0.5             network_1.17.1          assertthat_0.2.1
 [7] highr_0.9               stats4_4.1.1            blob_1.2.2
[10] GenomeInfoDbData_1.2.6  robustbase_0.93-8       pillar_1.6.2
[13] RSQLite_2.2.8           lattice_0.20-44         glue_1.4.2
[16] digest_0.6.27           XVector_0.32.0          colorspace_2.0-2
[19] Matrix_1.3-4            XML_3.99-0.7            pkgconfig_2.0.3
[22] zlibbioc_1.38.0         genefilter_1.74.0       purrr_0.3.4
[25] ergm_4.1.2              xtable_1.8-4            scales_1.1.1
[28] tibble_3.1.4            annotate_1.70.0         KEGGREST_1.32.0
[31] farver_2.1.0            generics_0.1.0          IRanges_2.26.0
[34] ellipsis_0.3.2          cachem_1.0.6            withr_2.4.2
[37] BiocGenerics_0.38.0     mime_0.11               survival_3.2-13
[40] magrittr_2.0.1          crayon_1.4.1            statnet.common_4.5.0
[43] memoise_2.0.0           laeken_0.5.1            fansi_0.5.0
[46] R.cache_0.15.0          MASS_7.3-54             R.rsp_0.44.0
[49] progressr_0.8.0         tools_4.1.1             lifecycle_1.0.0
[52] S4Vectors_0.30.0        trust_0.1-8             munsell_0.5.0
[55] tabby_0.0.1-9001        AnnotationDbi_1.54.1    Biostrings_2.60.2
[58] compiler_4.1.1          GenomeInfoDb_1.28.1     rlang_0.4.11
[61] grid_4.1.1              RCurl_1.98-1.4          cwhmisc_6.6
[64] rstudioapi_0.13         rappdirs_0.3.3          startup_0.15.0
[67] labeling_0.4.2          bitops_1.0-7            base64enc_0.1-3
[70] boot_1.3-28             gtable_0.3.0            DBI_1.1.1
[73] markdown_1.1            R6_2.5.1                lpSolveAPI_5.5.2.0-17.7
[76] rle_0.9.2               dplyr_1.0.7             fastmap_1.1.0
[79] bit_4.0.4               utf8_1.2.2              parallel_4.1.1
[82] Rcpp_1.0.7              vctrs_0.3.8             png_0.1-7
[85] DEoptimR_1.0-9          tidyselect_1.1.1        xfun_0.25
[88] coda_0.19-4
Total processing time was 13.05 secs.
Reproducibility
To reproduce this report, do:
html <- matrixStats:::benchmark('colRowLogSumExps_subset')
Copyright Dongcan Jiang. Last updated on 2021-08-25 22:16:26 (+0200 UTC). Powered by RSP.