matrixStats.benchmarks
colAnys() and rowAnys() benchmarks on subsetted computation
This report benchmark the performance of colAnys() and rowAnys() on subsetted computation.
Data
> rmatrix <- function(nrow, ncol, mode = c("logical", "double", "integer", "index"), range = c(-100,
+     +100), na_prob = 0) {
+     mode <- match.arg(mode)
+     n <- nrow * ncol
+     if (mode == "logical") {
+         x <- sample(c(FALSE, TRUE), size = n, replace = TRUE)
+     }     else if (mode == "index") {
+         x <- seq_len(n)
+         mode <- "integer"
+     }     else {
+         x <- runif(n, min = range[1], max = range[2])
+     }
+     storage.mode(x) <- mode
+     if (na_prob > 0)
+         x[sample(n, size = na_prob * n)] <- NA
+     dim(x) <- c(nrow, ncol)
+     x
+ }
> rmatrices <- function(scale = 10, seed = 1, ...) {
+     set.seed(seed)
+     data <- list()
+     data[[1]] <- rmatrix(nrow = scale * 1, ncol = scale * 1, ...)
+     data[[2]] <- rmatrix(nrow = scale * 10, ncol = scale * 10, ...)
+     data[[3]] <- rmatrix(nrow = scale * 100, ncol = scale * 1, ...)
+     data[[4]] <- t(data[[3]])
+     data[[5]] <- rmatrix(nrow = scale * 10, ncol = scale * 100, ...)
+     data[[6]] <- t(data[[5]])
+     names(data) <- sapply(data, FUN = function(x) paste(dim(x), collapse = "x"))
+     data
+ }
> data <- rmatrices(mode = "logical")
Results
10x10 matrix
> X <- data[["10x10"]]
> rows <- sample.int(nrow(X), size = nrow(X) * 0.7)
> cols <- sample.int(ncol(X), size = ncol(X) * 0.7)
> X_S <- X[rows, cols]
> gc()
          used  (Mb) gc trigger  (Mb) max used  (Mb)
Ncells 5188684 277.2    7916910 422.9  7916910 422.9
Vcells 9660610  73.8   33191153 253.3 53339345 407.0
> colStats <- microbenchmark(colAnys_X_S = colAnys(X_S), `colAnys(X, rows, cols)` = colAnys(X, rows = rows,
+     cols = cols), `colAnys(X[rows, cols])` = colAnys(X[rows, cols]), unit = "ms")
> X <- t(X)
> X_S <- t(X_S)
> gc()
          used  (Mb) gc trigger  (Mb) max used  (Mb)
Ncells 5176211 276.5    7916910 422.9  7916910 422.9
Vcells 9619437  73.4   33191153 253.3 53339345 407.0
> rowStats <- microbenchmark(rowAnys_X_S = rowAnys(X_S), `rowAnys(X, cols, rows)` = rowAnys(X, rows = cols,
+     cols = rows), `rowAnys(X[cols, rows])` = rowAnys(X[cols, rows]), unit = "ms")
Table: Benchmarking of colAnys_X_S(), colAnys(X, rows, cols)() and colAnys(X[rows, cols])() on 10x10 data. The top panel shows times in milliseconds and the bottom panel shows relative times.
| expr | min | lq | mean | median | uq | max | |
|---|---|---|---|---|---|---|---|
| 1 | colAnys_X_S | 0.002930 | 0.0030130 | 0.0034933 | 0.0030805 | 0.0031920 | 0.038657 |
| 2 | colAnys(X, rows, cols) | 0.003307 | 0.0033805 | 0.0035147 | 0.0034485 | 0.0035475 | 0.006015 |
| 3 | colAnys(X[rows, cols]) | 0.003863 | 0.0040900 | 0.0043063 | 0.0041940 | 0.0043575 | 0.009443 |
| expr | min | lq | mean | median | uq | max | |
|---|---|---|---|---|---|---|---|
| 1 | colAnys_X_S | 1.000000 | 1.000000 | 1.000000 | 1.000000 | 1.000000 | 1.0000000 |
| 2 | colAnys(X, rows, cols) | 1.128669 | 1.121971 | 1.006120 | 1.119461 | 1.111372 | 0.1555992 |
| 3 | colAnys(X[rows, cols]) | 1.318430 | 1.357451 | 1.232746 | 1.361467 | 1.365132 | 0.2442766 |
Table: Benchmarking of rowAnys_X_S(), rowAnys(X, cols, rows)() and rowAnys(X[cols, rows])() on 10x10 data (transposed). The top panel shows times in milliseconds and the bottom panel shows relative times.
| expr | min | lq | mean | median | uq | max | |
|---|---|---|---|---|---|---|---|
| 1 | rowAnys_X_S | 0.003047 | 0.0031180 | 0.0032598 | 0.0032035 | 0.0033160 | 0.005813 |
| 2 | rowAnys(X, cols, rows) | 0.003389 | 0.0034930 | 0.0038184 | 0.0035510 | 0.0036435 | 0.025154 |
| 3 | rowAnys(X[cols, rows]) | 0.003917 | 0.0041905 | 0.0045482 | 0.0043165 | 0.0044505 | 0.019656 |
| expr | min | lq | mean | median | uq | max | |
|---|---|---|---|---|---|---|---|
| 1 | rowAnys_X_S | 1.000000 | 1.000000 | 1.000000 | 1.000000 | 1.000000 | 1.000000 |
| 2 | rowAnys(X, cols, rows) | 1.112242 | 1.120269 | 1.171372 | 1.108475 | 1.098764 | 4.327198 |
| 3 | rowAnys(X[cols, rows]) | 1.285527 | 1.343970 | 1.395259 | 1.347433 | 1.342129 | 3.381387 |
Figure: Benchmarking of colAnys_X_S(), colAnys(X, rows, cols)() and colAnys(X[rows, cols])() on 10x10 data as well as rowAnys_X_S(), rowAnys(X, cols, rows)() and rowAnys(X[cols, rows])() on the same data transposed. Outliers are displayed as crosses. Times are in milliseconds.
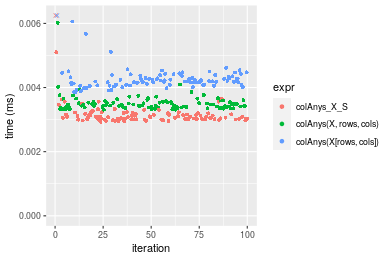
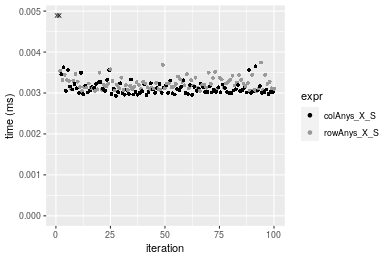
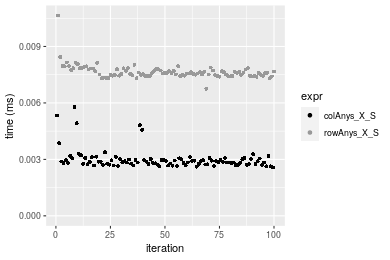
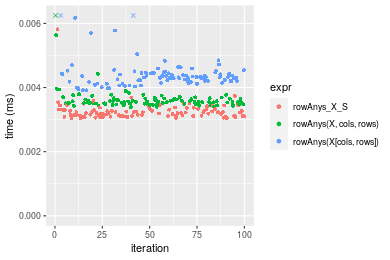 Table: Benchmarking of colAnys_X_S() and rowAnys_X_S() on 10x10 data (original and transposed). The top panel shows times in milliseconds and the bottom panel shows relative times.
| expr | min | lq | mean | median | uq | max | |
|---|---|---|---|---|---|---|---|
| 1 | colAnys_X_S | 2.930 | 3.013 | 3.49329 | 3.0805 | 3.192 | 38.657 |
| 2 | rowAnys_X_S | 3.047 | 3.118 | 3.25976 | 3.2035 | 3.316 | 5.813 |
| expr | min | lq | mean | median | uq | max | |
|---|---|---|---|---|---|---|---|
| 1 | colAnys_X_S | 1.000000 | 1.000000 | 1.000000 | 1.000000 | 1.000000 | 1.0000000 |
| 2 | rowAnys_X_S | 1.039932 | 1.034849 | 0.933149 | 1.039929 | 1.038847 | 0.1503738 |
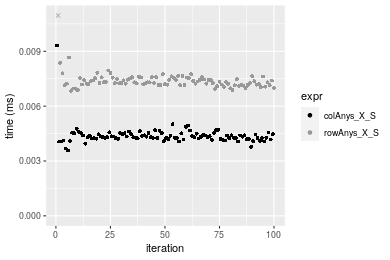
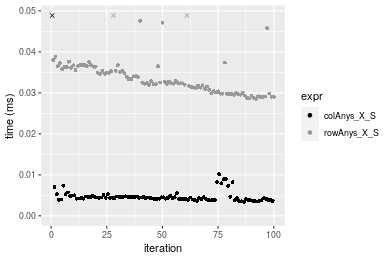
Figure: Benchmarking of colAnys_X_S() and rowAnys_X_S() on 10x10 data (original and transposed). Outliers are displayed as crosses. Times are in milliseconds.
100x100 matrix
> X <- data[["100x100"]]
> rows <- sample.int(nrow(X), size = nrow(X) * 0.7)
> cols <- sample.int(ncol(X), size = ncol(X) * 0.7)
> X_S <- X[rows, cols]
> gc()
          used  (Mb) gc trigger  (Mb) max used  (Mb)
Ncells 5174714 276.4    7916910 422.9  7916910 422.9
Vcells 9287535  70.9   33191153 253.3 53339345 407.0
> colStats <- microbenchmark(colAnys_X_S = colAnys(X_S), `colAnys(X, rows, cols)` = colAnys(X, rows = rows,
+     cols = cols), `colAnys(X[rows, cols])` = colAnys(X[rows, cols]), unit = "ms")
> X <- t(X)
> X_S <- t(X_S)
> gc()
          used  (Mb) gc trigger  (Mb) max used  (Mb)
Ncells 5174708 276.4    7916910 422.9  7916910 422.9
Vcells 9292618  70.9   33191153 253.3 53339345 407.0
> rowStats <- microbenchmark(rowAnys_X_S = rowAnys(X_S), `rowAnys(X, cols, rows)` = rowAnys(X, rows = cols,
+     cols = rows), `rowAnys(X[cols, rows])` = rowAnys(X[cols, rows]), unit = "ms")
Table: Benchmarking of colAnys_X_S(), colAnys(X, rows, cols)() and colAnys(X[rows, cols])() on 100x100 data. The top panel shows times in milliseconds and the bottom panel shows relative times.
| expr | min | lq | mean | median | uq | max | |
|---|---|---|---|---|---|---|---|
| 1 | colAnys_X_S | 0.003573 | 0.0042250 | 0.0043878 | 0.0043140 | 0.0044845 | 0.009324 |
| 2 | colAnys(X, rows, cols) | 0.004632 | 0.0050145 | 0.0052862 | 0.0051615 | 0.0054005 | 0.010560 |
| 3 | colAnys(X[rows, cols]) | 0.019930 | 0.0205055 | 0.0211904 | 0.0206595 | 0.0208530 | 0.055832 |
| expr | min | lq | mean | median | uq | max | |
|---|---|---|---|---|---|---|---|
| 1 | colAnys_X_S | 1.000000 | 1.000000 | 1.000000 | 1.000000 | 1.000000 | 1.000000 |
| 2 | colAnys(X, rows, cols) | 1.296390 | 1.186864 | 1.204764 | 1.196453 | 1.204259 | 1.132561 |
| 3 | colAnys(X[rows, cols]) | 5.577946 | 4.853373 | 4.829419 | 4.788943 | 4.650017 | 5.987988 |
Table: Benchmarking of rowAnys_X_S(), rowAnys(X, cols, rows)() and rowAnys(X[cols, rows])() on 100x100 data (transposed). The top panel shows times in milliseconds and the bottom panel shows relative times.
| expr | min | lq | mean | median | uq | max | |
|---|---|---|---|---|---|---|---|
| 1 | rowAnys_X_S | 0.006843 | 0.0071765 | 0.0074067 | 0.0073050 | 0.0075390 | 0.012472 |
| 2 | rowAnys(X, cols, rows) | 0.008635 | 0.0089120 | 0.0093772 | 0.0091115 | 0.0093270 | 0.029578 |
| 3 | rowAnys(X[cols, rows]) | 0.022994 | 0.0235035 | 0.0239004 | 0.0236860 | 0.0239135 | 0.034484 |
| expr | min | lq | mean | median | uq | max | |
|---|---|---|---|---|---|---|---|
| 1 | rowAnys_X_S | 1.000000 | 1.000000 | 1.000000 | 1.000000 | 1.000000 | 1.000000 |
| 2 | rowAnys(X, cols, rows) | 1.261873 | 1.241831 | 1.266055 | 1.247296 | 1.237167 | 2.371552 |
| 3 | rowAnys(X[cols, rows]) | 3.360222 | 3.275064 | 3.226886 | 3.242437 | 3.171972 | 2.764913 |
Figure: Benchmarking of colAnys_X_S(), colAnys(X, rows, cols)() and colAnys(X[rows, cols])() on 100x100 data as well as rowAnys_X_S(), rowAnys(X, cols, rows)() and rowAnys(X[cols, rows])() on the same data transposed. Outliers are displayed as crosses. Times are in milliseconds.
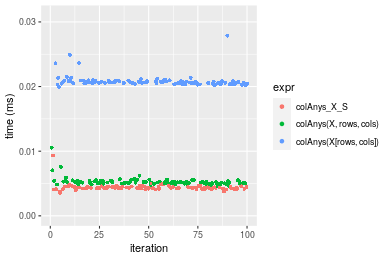
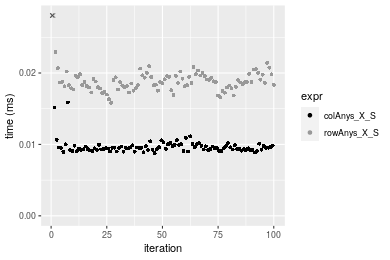
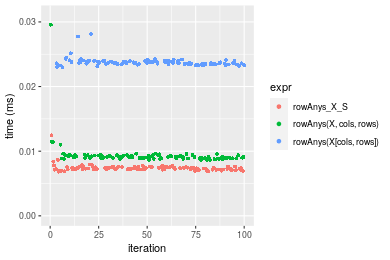 Table: Benchmarking of colAnys_X_S() and rowAnys_X_S() on 100x100 data (original and transposed). The top panel shows times in milliseconds and the bottom panel shows relative times.
| expr | min | lq | mean | median | uq | max | |
|---|---|---|---|---|---|---|---|
| 1 | colAnys_X_S | 3.573 | 4.2250 | 4.38778 | 4.314 | 4.4845 | 9.324 |
| 2 | rowAnys_X_S | 6.843 | 7.1765 | 7.40666 | 7.305 | 7.5390 | 12.472 |
| expr | min | lq | mean | median | uq | max | |
|---|---|---|---|---|---|---|---|
| 1 | colAnys_X_S | 1.000000 | 1.00000 | 1.00000 | 1.000000 | 1.000000 | 1.000000 |
| 2 | rowAnys_X_S | 1.915197 | 1.69858 | 1.68802 | 1.693324 | 1.681124 | 1.337623 |
Figure: Benchmarking of colAnys_X_S() and rowAnys_X_S() on 100x100 data (original and transposed). Outliers are displayed as crosses. Times are in milliseconds.
1000x10 matrix
> X <- data[["1000x10"]]
> rows <- sample.int(nrow(X), size = nrow(X) * 0.7)
> cols <- sample.int(ncol(X), size = ncol(X) * 0.7)
> X_S <- X[rows, cols]
> gc()
          used  (Mb) gc trigger  (Mb) max used  (Mb)
Ncells 5175456 276.4    7916910 422.9  7916910 422.9
Vcells 9291597  70.9   33191153 253.3 53339345 407.0
> colStats <- microbenchmark(colAnys_X_S = colAnys(X_S), `colAnys(X, rows, cols)` = colAnys(X, rows = rows,
+     cols = cols), `colAnys(X[rows, cols])` = colAnys(X[rows, cols]), unit = "ms")
> X <- t(X)
> X_S <- t(X_S)
> gc()
          used  (Mb) gc trigger  (Mb) max used  (Mb)
Ncells 5175450 276.4    7916910 422.9  7916910 422.9
Vcells 9296680  71.0   33191153 253.3 53339345 407.0
> rowStats <- microbenchmark(rowAnys_X_S = rowAnys(X_S), `rowAnys(X, cols, rows)` = rowAnys(X, rows = cols,
+     cols = rows), `rowAnys(X[cols, rows])` = rowAnys(X[cols, rows]), unit = "ms")
Table: Benchmarking of colAnys_X_S(), colAnys(X, rows, cols)() and colAnys(X[rows, cols])() on 1000x10 data. The top panel shows times in milliseconds and the bottom panel shows relative times.
| expr | min | lq | mean | median | uq | max | |
|---|---|---|---|---|---|---|---|
| 1 | colAnys_X_S | 0.002564 | 0.0027485 | 0.0029968 | 0.0028745 | 0.0030155 | 0.005786 |
| 2 | colAnys(X, rows, cols) | 0.004184 | 0.0043735 | 0.0049011 | 0.0045010 | 0.0046745 | 0.019652 |
| 3 | colAnys(X[rows, cols]) | 0.017284 | 0.0179775 | 0.0193245 | 0.0181460 | 0.0184340 | 0.067742 |
| expr | min | lq | mean | median | uq | max | |
|---|---|---|---|---|---|---|---|
| 1 | colAnys_X_S | 1.000000 | 1.000000 | 1.000000 | 1.000000 | 1.000000 | 1.000000 |
| 2 | colAnys(X, rows, cols) | 1.631825 | 1.591232 | 1.635461 | 1.565837 | 1.550158 | 3.396474 |
| 3 | colAnys(X[rows, cols]) | 6.741030 | 6.540840 | 6.448456 | 6.312750 | 6.113082 | 11.707916 |
Table: Benchmarking of rowAnys_X_S(), rowAnys(X, cols, rows)() and rowAnys(X[cols, rows])() on 1000x10 data (transposed). The top panel shows times in milliseconds and the bottom panel shows relative times.
| expr | min | lq | mean | median | uq | max | |
|---|---|---|---|---|---|---|---|
| 1 | rowAnys_X_S | 0.006749 | 0.0074610 | 0.0076552 | 0.0075905 | 0.0077825 | 0.010647 |
| 2 | rowAnys(X, cols, rows) | 0.010388 | 0.0105925 | 0.0109814 | 0.0107090 | 0.0109270 | 0.025281 |
| 3 | rowAnys(X[cols, rows]) | 0.023532 | 0.0244635 | 0.0251698 | 0.0247120 | 0.0249720 | 0.058241 |
| expr | min | lq | mean | median | uq | max | |
|---|---|---|---|---|---|---|---|
| 1 | rowAnys_X_S | 1.000000 | 1.000000 | 1.000000 | 1.000000 | 1.000000 | 1.000000 |
| 2 | rowAnys(X, cols, rows) | 1.539191 | 1.419716 | 1.434502 | 1.410842 | 1.404047 | 2.374472 |
| 3 | rowAnys(X[cols, rows]) | 3.486739 | 3.278850 | 3.287948 | 3.255648 | 3.208738 | 5.470179 |
Figure: Benchmarking of colAnys_X_S(), colAnys(X, rows, cols)() and colAnys(X[rows, cols])() on 1000x10 data as well as rowAnys_X_S(), rowAnys(X, cols, rows)() and rowAnys(X[cols, rows])() on the same data transposed. Outliers are displayed as crosses. Times are in milliseconds.
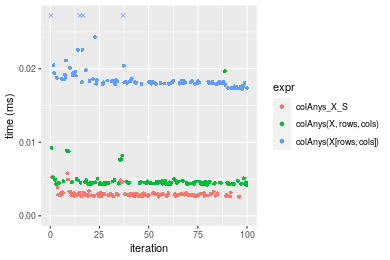
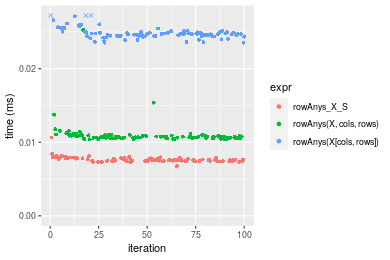 Table: Benchmarking of colAnys_X_S() and rowAnys_X_S() on 1000x10 data (original and transposed). The top panel shows times in milliseconds and the bottom panel shows relative times.
| expr | min | lq | mean | median | uq | max | |
|---|---|---|---|---|---|---|---|
| 1 | colAnys_X_S | 2.564 | 2.7485 | 2.99677 | 2.8745 | 3.0155 | 5.786 |
| 2 | rowAnys_X_S | 6.749 | 7.4610 | 7.65518 | 7.5905 | 7.7825 | 10.647 |
| expr | min | lq | mean | median | uq | max | |
|---|---|---|---|---|---|---|---|
| 1 | colAnys_X_S | 1.000000 | 1.000000 | 1.000000 | 1.000000 | 1.000000 | 1.000000 |
| 2 | rowAnys_X_S | 2.632215 | 2.714572 | 2.554477 | 2.640633 | 2.580832 | 1.840131 |
Figure: Benchmarking of colAnys_X_S() and rowAnys_X_S() on 1000x10 data (original and transposed). Outliers are displayed as crosses. Times are in milliseconds.
10x1000 matrix
> X <- data[["10x1000"]]
> rows <- sample.int(nrow(X), size = nrow(X) * 0.7)
> cols <- sample.int(ncol(X), size = ncol(X) * 0.7)
> X_S <- X[rows, cols]
> gc()
          used  (Mb) gc trigger  (Mb) max used  (Mb)
Ncells 5175661 276.5    7916910 422.9  7916910 422.9
Vcells 9292399  70.9   33191153 253.3 53339345 407.0
> colStats <- microbenchmark(colAnys_X_S = colAnys(X_S), `colAnys(X, rows, cols)` = colAnys(X, rows = rows,
+     cols = cols), `colAnys(X[rows, cols])` = colAnys(X[rows, cols]), unit = "ms")
> X <- t(X)
> X_S <- t(X_S)
> gc()
          used  (Mb) gc trigger  (Mb) max used  (Mb)
Ncells 5175655 276.5    7916910 422.9  7916910 422.9
Vcells 9297482  71.0   33191153 253.3 53339345 407.0
> rowStats <- microbenchmark(rowAnys_X_S = rowAnys(X_S), `rowAnys(X, cols, rows)` = rowAnys(X, rows = cols,
+     cols = rows), `rowAnys(X[cols, rows])` = rowAnys(X[cols, rows]), unit = "ms")
Table: Benchmarking of colAnys_X_S(), colAnys(X, rows, cols)() and colAnys(X[rows, cols])() on 10x1000 data. The top panel shows times in milliseconds and the bottom panel shows relative times.
| expr | min | lq | mean | median | uq | max | |
|---|---|---|---|---|---|---|---|
| 1 | colAnys_X_S | 0.008787 | 0.0092365 | 0.0099198 | 0.0094915 | 0.0098225 | 0.034262 |
| 2 | colAnys(X, rows, cols) | 0.014272 | 0.0157160 | 0.0168987 | 0.0166265 | 0.0175950 | 0.032779 |
| 3 | colAnys(X[rows, cols]) | 0.026595 | 0.0272925 | 0.0279215 | 0.0276620 | 0.0281760 | 0.035218 |
| expr | min | lq | mean | median | uq | max | |
|---|---|---|---|---|---|---|---|
| 1 | colAnys_X_S | 1.000000 | 1.000000 | 1.000000 | 1.000000 | 1.000000 | 1.0000000 |
| 2 | colAnys(X, rows, cols) | 1.624218 | 1.701510 | 1.703535 | 1.751725 | 1.791295 | 0.9567159 |
| 3 | colAnys(X[rows, cols]) | 3.026630 | 2.954853 | 2.814729 | 2.914397 | 2.868516 | 1.0279026 |
Table: Benchmarking of rowAnys_X_S(), rowAnys(X, cols, rows)() and rowAnys(X[cols, rows])() on 10x1000 data (transposed). The top panel shows times in milliseconds and the bottom panel shows relative times.
| expr | min | lq | mean | median | uq | max | |
|---|---|---|---|---|---|---|---|
| 1 | rowAnys_X_S | 0.015830 | 0.0180065 | 0.0188890 | 0.0186940 | 0.0195920 | 0.030861 |
| 2 | rowAnys(X, cols, rows) | 0.017856 | 0.0198510 | 0.0215851 | 0.0211440 | 0.0223630 | 0.057227 |
| 3 | rowAnys(X[cols, rows]) | 0.033657 | 0.0351845 | 0.0363950 | 0.0360385 | 0.0369075 | 0.048438 |
| expr | min | lq | mean | median | uq | max | |
|---|---|---|---|---|---|---|---|
| 1 | rowAnys_X_S | 1.000000 | 1.000000 | 1.000000 | 1.000000 | 1.000000 | 1.000000 |
| 2 | rowAnys(X, cols, rows) | 1.127985 | 1.102435 | 1.142733 | 1.131058 | 1.141435 | 1.854347 |
| 3 | rowAnys(X[cols, rows]) | 2.126153 | 1.953989 | 1.926783 | 1.927811 | 1.883805 | 1.569554 |
Figure: Benchmarking of colAnys_X_S(), colAnys(X, rows, cols)() and colAnys(X[rows, cols])() on 10x1000 data as well as rowAnys_X_S(), rowAnys(X, cols, rows)() and rowAnys(X[cols, rows])() on the same data transposed. Outliers are displayed as crosses. Times are in milliseconds.
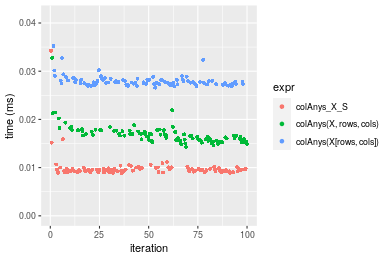
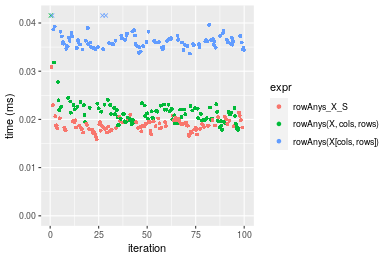 Table: Benchmarking of colAnys_X_S() and rowAnys_X_S() on 10x1000 data (original and transposed). The top panel shows times in milliseconds and the bottom panel shows relative times.
| expr | min | lq | mean | median | uq | max | |
|---|---|---|---|---|---|---|---|
| 1 | colAnys_X_S | 8.787 | 9.2365 | 9.91978 | 9.4915 | 9.8225 | 34.262 |
| 2 | rowAnys_X_S | 15.830 | 18.0065 | 18.88902 | 18.6940 | 19.5920 | 30.861 |
| expr | min | lq | mean | median | uq | max | |
|---|---|---|---|---|---|---|---|
| 1 | colAnys_X_S | 1.000000 | 1.000000 | 1.000000 | 1.000000 | 1.000000 | 1.0000000 |
| 2 | rowAnys_X_S | 1.801525 | 1.949494 | 1.904177 | 1.969552 | 1.994604 | 0.9007355 |
Figure: Benchmarking of colAnys_X_S() and rowAnys_X_S() on 10x1000 data (original and transposed). Outliers are displayed as crosses. Times are in milliseconds.
100x1000 matrix
> X <- data[["100x1000"]]
> rows <- sample.int(nrow(X), size = nrow(X) * 0.7)
> cols <- sample.int(ncol(X), size = ncol(X) * 0.7)
> X_S <- X[rows, cols]
> gc()
          used  (Mb) gc trigger  (Mb) max used  (Mb)
Ncells 5175872 276.5    7916910 422.9  7916910 422.9
Vcells 9315056  71.1   33191153 253.3 53339345 407.0
> colStats <- microbenchmark(colAnys_X_S = colAnys(X_S), `colAnys(X, rows, cols)` = colAnys(X, rows = rows,
+     cols = cols), `colAnys(X[rows, cols])` = colAnys(X[rows, cols]), unit = "ms")
> X <- t(X)
> X_S <- t(X_S)
> gc()
          used  (Mb) gc trigger  (Mb) max used  (Mb)
Ncells 5175866 276.5    7916910 422.9  7916910 422.9
Vcells 9365139  71.5   33191153 253.3 53339345 407.0
> rowStats <- microbenchmark(rowAnys_X_S = rowAnys(X_S), `rowAnys(X, cols, rows)` = rowAnys(X, rows = cols,
+     cols = rows), `rowAnys(X[cols, rows])` = rowAnys(X[cols, rows]), unit = "ms")
Table: Benchmarking of colAnys_X_S(), colAnys(X, rows, cols)() and colAnys(X[rows, cols])() on 100x1000 data. The top panel shows times in milliseconds and the bottom panel shows relative times.
| expr | min | lq | mean | median | uq | max | |
|---|---|---|---|---|---|---|---|
| 1 | colAnys_X_S | 0.007847 | 0.0095535 | 0.0130375 | 0.0104190 | 0.0116260 | 0.202438 |
| 2 | colAnys(X, rows, cols) | 0.015156 | 0.0179930 | 0.0220193 | 0.0195060 | 0.0218700 | 0.162111 |
| 3 | colAnys(X[rows, cols]) | 0.127508 | 0.1375465 | 0.1524893 | 0.1447325 | 0.1582585 | 0.402061 |
| expr | min | lq | mean | median | uq | max | |
|---|---|---|---|---|---|---|---|
| 1 | colAnys_X_S | 1.000000 | 1.000000 | 1.000000 | 1.000000 | 1.000000 | 1.0000000 |
| 2 | colAnys(X, rows, cols) | 1.931439 | 1.883393 | 1.688927 | 1.872157 | 1.881128 | 0.8007933 |
| 3 | colAnys(X[rows, cols]) | 16.249267 | 14.397498 | 11.696236 | 13.891208 | 13.612463 | 1.9860945 |
Table: Benchmarking of rowAnys_X_S(), rowAnys(X, cols, rows)() and rowAnys(X[cols, rows])() on 100x1000 data (transposed). The top panel shows times in milliseconds and the bottom panel shows relative times.
| expr | min | lq | mean | median | uq | max | |
|---|---|---|---|---|---|---|---|
| 1 | rowAnys_X_S | 0.037752 | 0.040540 | 0.0444943 | 0.0429665 | 0.0469935 | 0.090564 |
| 2 | rowAnys(X, cols, rows) | 0.046380 | 0.049515 | 0.0556728 | 0.0524730 | 0.0583040 | 0.090504 |
| 3 | rowAnys(X[cols, rows]) | 0.155799 | 0.163449 | 0.1811614 | 0.1732020 | 0.1902805 | 0.288360 |
| expr | min | lq | mean | median | uq | max | |
|---|---|---|---|---|---|---|---|
| 1 | rowAnys_X_S | 1.000000 | 1.000000 | 1.000000 | 1.000000 | 1.000000 | 1.0000000 |
| 2 | rowAnys(X, cols, rows) | 1.228544 | 1.221386 | 1.251233 | 1.221254 | 1.240682 | 0.9993375 |
| 3 | rowAnys(X[cols, rows]) | 4.126907 | 4.031796 | 4.071561 | 4.031094 | 4.049081 | 3.1840466 |
Figure: Benchmarking of colAnys_X_S(), colAnys(X, rows, cols)() and colAnys(X[rows, cols])() on 100x1000 data as well as rowAnys_X_S(), rowAnys(X, cols, rows)() and rowAnys(X[cols, rows])() on the same data transposed. Outliers are displayed as crosses. Times are in milliseconds.
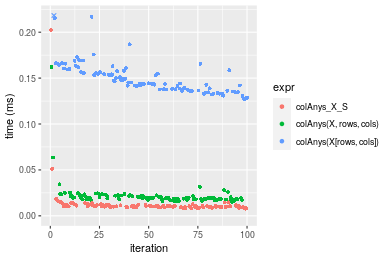
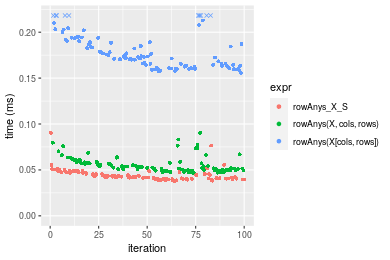 Table: Benchmarking of colAnys_X_S() and rowAnys_X_S() on 100x1000 data (original and transposed). The top panel shows times in milliseconds and the bottom panel shows relative times.
| expr | min | lq | mean | median | uq | max | |
|---|---|---|---|---|---|---|---|
| 1 | colAnys_X_S | 7.847 | 9.5535 | 13.03747 | 10.4190 | 11.6260 | 202.438 |
| 2 | rowAnys_X_S | 37.752 | 40.5400 | 44.49434 | 42.9665 | 46.9935 | 90.564 |
| expr | min | lq | mean | median | uq | max | |
|---|---|---|---|---|---|---|---|
| 1 | colAnys_X_S | 1.000000 | 1.000000 | 1.000000 | 1.00000 | 1.000000 | 1.0000000 |
| 2 | rowAnys_X_S | 4.811011 | 4.243471 | 3.412805 | 4.12386 | 4.042104 | 0.4473666 |
Figure: Benchmarking of colAnys_X_S() and rowAnys_X_S() on 100x1000 data (original and transposed). Outliers are displayed as crosses. Times are in milliseconds.
1000x100 matrix
> X <- data[["1000x100"]]
> rows <- sample.int(nrow(X), size = nrow(X) * 0.7)
> cols <- sample.int(ncol(X), size = ncol(X) * 0.7)
> X_S <- X[rows, cols]
> gc()
          used  (Mb) gc trigger  (Mb) max used  (Mb)
Ncells 5176082 276.5    7916910 422.9  7916910 422.9
Vcells 9315719  71.1   33191153 253.3 53339345 407.0
> colStats <- microbenchmark(colAnys_X_S = colAnys(X_S), `colAnys(X, rows, cols)` = colAnys(X, rows = rows,
+     cols = cols), `colAnys(X[rows, cols])` = colAnys(X[rows, cols]), unit = "ms")
> X <- t(X)
> X_S <- t(X_S)
> gc()
          used  (Mb) gc trigger  (Mb) max used  (Mb)
Ncells 5176076 276.5    7916910 422.9  7916910 422.9
Vcells 9365802  71.5   33191153 253.3 53339345 407.0
> rowStats <- microbenchmark(rowAnys_X_S = rowAnys(X_S), `rowAnys(X, cols, rows)` = rowAnys(X, rows = cols,
+     cols = rows), `rowAnys(X[cols, rows])` = rowAnys(X[cols, rows]), unit = "ms")
Table: Benchmarking of colAnys_X_S(), colAnys(X, rows, cols)() and colAnys(X[rows, cols])() on 1000x100 data. The top panel shows times in milliseconds and the bottom panel shows relative times.
| expr | min | lq | mean | median | uq | max | |
|---|---|---|---|---|---|---|---|
| 1 | colAnys_X_S | 0.003440 | 0.0040895 | 0.0051360 | 0.0044105 | 0.0046860 | 0.050062 |
| 2 | colAnys(X, rows, cols) | 0.005489 | 0.0062070 | 0.0073317 | 0.0065205 | 0.0070770 | 0.018352 |
| 3 | colAnys(X[rows, cols]) | 0.135830 | 0.1478650 | 0.1600207 | 0.1538385 | 0.1550925 | 0.265843 |
| expr | min | lq | mean | median | uq | max | |
|---|---|---|---|---|---|---|---|
| 1 | colAnys_X_S | 1.00000 | 1.000000 | 1.000000 | 1.000000 | 1.000000 | 1.0000000 |
| 2 | colAnys(X, rows, cols) | 1.59564 | 1.517789 | 1.427511 | 1.478404 | 1.510243 | 0.3665854 |
| 3 | colAnys(X[rows, cols]) | 39.48547 | 36.157232 | 31.156492 | 34.880059 | 33.096991 | 5.3102753 |
Table: Benchmarking of rowAnys_X_S(), rowAnys(X, cols, rows)() and rowAnys(X[cols, rows])() on 1000x100 data (transposed). The top panel shows times in milliseconds and the bottom panel shows relative times.
| expr | min | lq | mean | median | uq | max | |
|---|---|---|---|---|---|---|---|
| 1 | rowAnys_X_S | 0.028583 | 0.0302235 | 0.0336784 | 0.0325155 | 0.0361905 | 0.050566 |
| 2 | rowAnys(X, cols, rows) | 0.039778 | 0.0438025 | 0.0466066 | 0.0449325 | 0.0489830 | 0.072146 |
| 3 | rowAnys(X[cols, rows]) | 0.147722 | 0.1591480 | 0.1696369 | 0.1659490 | 0.1841890 | 0.246828 |
| expr | min | lq | mean | median | uq | max | |
|---|---|---|---|---|---|---|---|
| 1 | rowAnys_X_S | 1.000000 | 1.000000 | 1.000000 | 1.000000 | 1.000000 | 1.000000 |
| 2 | rowAnys(X, cols, rows) | 1.391666 | 1.449286 | 1.383875 | 1.381879 | 1.353477 | 1.426769 |
| 3 | rowAnys(X[cols, rows]) | 5.168177 | 5.265704 | 5.036969 | 5.103689 | 5.089429 | 4.881304 |
Figure: Benchmarking of colAnys_X_S(), colAnys(X, rows, cols)() and colAnys(X[rows, cols])() on 1000x100 data as well as rowAnys_X_S(), rowAnys(X, cols, rows)() and rowAnys(X[cols, rows])() on the same data transposed. Outliers are displayed as crosses. Times are in milliseconds.
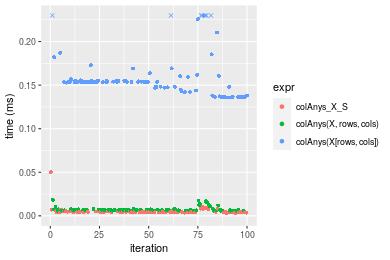
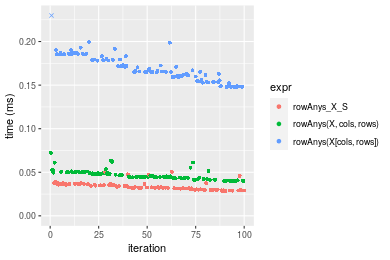 Table: Benchmarking of colAnys_X_S() and rowAnys_X_S() on 1000x100 data (original and transposed). The top panel shows times in milliseconds and the bottom panel shows relative times.
| expr | min | lq | mean | median | uq | max | |
|---|---|---|---|---|---|---|---|
| 1 | colAnys_X_S | 3.440 | 4.0895 | 5.13603 | 4.4105 | 4.6860 | 50.062 |
| 2 | rowAnys_X_S | 28.583 | 30.2235 | 33.67836 | 32.5155 | 36.1905 | 50.566 |
| expr | min | lq | mean | median | uq | max | |
|---|---|---|---|---|---|---|---|
| 1 | colAnys_X_S | 1.000000 | 1.000000 | 1.000000 | 1.000000 | 1.000000 | 1.000000 |
| 2 | rowAnys_X_S | 8.309012 | 7.390512 | 6.557275 | 7.372293 | 7.723111 | 1.010067 |
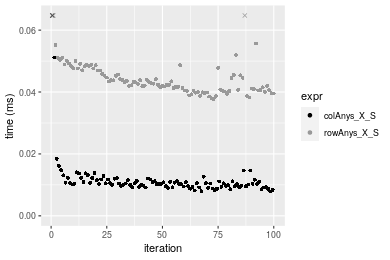
Figure: Benchmarking of colAnys_X_S() and rowAnys_X_S() on 1000x100 data (original and transposed). Outliers are displayed as crosses. Times are in milliseconds.
Appendix
Session information
R version 4.1.1 Patched (2021-08-10 r80727)
Platform: x86_64-pc-linux-gnu (64-bit)
Running under: Ubuntu 18.04.5 LTS

Matrix products: default
BLAS:   /home/hb/software/R-devel/R-4-1-branch/lib/R/lib/libRblas.so
LAPACK: /home/hb/software/R-devel/R-4-1-branch/lib/R/lib/libRlapack.so

locale:
 [1] LC_CTYPE=en_US.UTF-8       LC_NUMERIC=C
 [3] LC_TIME=en_US.UTF-8        LC_COLLATE=en_US.UTF-8
 [5] LC_MONETARY=en_US.UTF-8    LC_MESSAGES=en_US.UTF-8
 [7] LC_PAPER=en_US.UTF-8       LC_NAME=C
 [9] LC_ADDRESS=C               LC_TELEPHONE=C
[11] LC_MEASUREMENT=en_US.UTF-8 LC_IDENTIFICATION=C

attached base packages:
[1] stats     graphics  grDevices utils     datasets  methods   base

other attached packages:
[1] microbenchmark_1.4-7   matrixStats_0.60.0     ggplot2_3.3.5
[4] knitr_1.33             R.devices_2.17.0       R.utils_2.10.1
[7] R.oo_1.24.0            R.methodsS3_1.8.1-9001 history_0.0.1-9000

loaded via a namespace (and not attached):
 [1] Biobase_2.52.0          httr_1.4.2              splines_4.1.1
 [4] bit64_4.0.5             network_1.17.1          assertthat_0.2.1
 [7] highr_0.9               stats4_4.1.1            blob_1.2.2
[10] GenomeInfoDbData_1.2.6  robustbase_0.93-8       pillar_1.6.2
[13] RSQLite_2.2.8           lattice_0.20-44         glue_1.4.2
[16] digest_0.6.27           XVector_0.32.0          colorspace_2.0-2
[19] Matrix_1.3-4            XML_3.99-0.7            pkgconfig_2.0.3
[22] zlibbioc_1.38.0         genefilter_1.74.0       purrr_0.3.4
[25] ergm_4.1.2              xtable_1.8-4            scales_1.1.1
[28] tibble_3.1.4            annotate_1.70.0         KEGGREST_1.32.0
[31] farver_2.1.0            generics_0.1.0          IRanges_2.26.0
[34] ellipsis_0.3.2          cachem_1.0.6            withr_2.4.2
[37] BiocGenerics_0.38.0     mime_0.11               survival_3.2-13
[40] magrittr_2.0.1          crayon_1.4.1            statnet.common_4.5.0
[43] memoise_2.0.0           laeken_0.5.1            fansi_0.5.0
[46] R.cache_0.15.0          MASS_7.3-54             R.rsp_0.44.0
[49] progressr_0.8.0         tools_4.1.1             lifecycle_1.0.0
[52] S4Vectors_0.30.0        trust_0.1-8             munsell_0.5.0
[55] tabby_0.0.1-9001        AnnotationDbi_1.54.1    Biostrings_2.60.2
[58] compiler_4.1.1          GenomeInfoDb_1.28.1     rlang_0.4.11
[61] grid_4.1.1              RCurl_1.98-1.4          cwhmisc_6.6
[64] rstudioapi_0.13         rappdirs_0.3.3          startup_0.15.0
[67] labeling_0.4.2          bitops_1.0-7            base64enc_0.1-3
[70] boot_1.3-28             gtable_0.3.0            DBI_1.1.1
[73] markdown_1.1            R6_2.5.1                lpSolveAPI_5.5.2.0-17.7
[76] rle_0.9.2               dplyr_1.0.7             fastmap_1.1.0
[79] bit_4.0.4               utf8_1.2.2              parallel_4.1.1
[82] Rcpp_1.0.7              vctrs_0.3.8             png_0.1-7
[85] DEoptimR_1.0-9          tidyselect_1.1.1        xfun_0.25
[88] coda_0.19-4
Total processing time was 11.3 secs.
Reproducibility
To reproduce this report, do:
html <- matrixStats:::benchmark('colRowAnys_subset')
Copyright Dongcan Jiang. Last updated on 2021-08-25 22:11:12 (+0200 UTC). Powered by RSP.