matrixStats.benchmarks
colAnys() and rowAnys() benchmarks
This report benchmark the performance of colAnys() and rowAnys() against alternative methods.
Alternative methods
- apply() + any()
- colSums() > 0 or rowSums() > 0
Data
> rmatrix <- function(nrow, ncol, mode = c("logical", "double", "integer", "index"), range = c(-100,
+     +100), na_prob = 0) {
+     mode <- match.arg(mode)
+     n <- nrow * ncol
+     if (mode == "logical") {
+         x <- sample(c(FALSE, TRUE), size = n, replace = TRUE)
+     }     else if (mode == "index") {
+         x <- seq_len(n)
+         mode <- "integer"
+     }     else {
+         x <- runif(n, min = range[1], max = range[2])
+     }
+     storage.mode(x) <- mode
+     if (na_prob > 0)
+         x[sample(n, size = na_prob * n)] <- NA
+     dim(x) <- c(nrow, ncol)
+     x
+ }
> rmatrices <- function(scale = 10, seed = 1, ...) {
+     set.seed(seed)
+     data <- list()
+     data[[1]] <- rmatrix(nrow = scale * 1, ncol = scale * 1, ...)
+     data[[2]] <- rmatrix(nrow = scale * 10, ncol = scale * 10, ...)
+     data[[3]] <- rmatrix(nrow = scale * 100, ncol = scale * 1, ...)
+     data[[4]] <- t(data[[3]])
+     data[[5]] <- rmatrix(nrow = scale * 10, ncol = scale * 100, ...)
+     data[[6]] <- t(data[[5]])
+     names(data) <- sapply(data, FUN = function(x) paste(dim(x), collapse = "x"))
+     data
+ }
> data <- rmatrices(mode = "logical")
Results
10x10 matrix
> X <- data[["10x10"]]
> gc()
          used  (Mb) gc trigger  (Mb) max used  (Mb)
Ncells 5192340 277.4    7916910 422.9  7916910 422.9
Vcells 9548887  72.9   33191153 253.3 53339345 407.0
> colStats <- microbenchmark(colAnys = colAnys(X), `apply+any` = apply(X, MARGIN = 2L, FUN = any),
+     `colSums > 0` = (colSums(X) > 0L), unit = "ms")
> X <- t(X)
> gc()
          used  (Mb) gc trigger  (Mb) max used  (Mb)
Ncells 5178649 276.6    7916910 422.9  7916910 422.9
Vcells 9503582  72.6   33191153 253.3 53339345 407.0
> rowStats <- microbenchmark(rowAnys = rowAnys(X), `apply+any` = apply(X, MARGIN = 1L, FUN = any),
+     `rowSums > 0` = (rowSums(X) > 0L), unit = "ms")
Table: Benchmarking of colAnys(), apply+any() and colSums > 0() on 10x10 data. The top panel shows times in milliseconds and the bottom panel shows relative times.
| expr | min | lq | mean | median | uq | max | |
|---|---|---|---|---|---|---|---|
| 1 | colAnys | 0.003015 | 0.0033380 | 0.0043223 | 0.0042475 | 0.0045720 | 0.019112 |
| 3 | colSums > 0 | 0.005908 | 0.0063745 | 0.0080616 | 0.0071145 | 0.0079250 | 0.054657 |
| 2 | apply+any | 0.033156 | 0.0347580 | 0.0377213 | 0.0355990 | 0.0368595 | 0.084983 |
| expr | min | lq | mean | median | uq | max | |
|---|---|---|---|---|---|---|---|
| 1 | colAnys | 1.000000 | 1.000000 | 1.000000 | 1.000000 | 1.000000 | 1.000000 |
| 3 | colSums > 0 | 1.959536 | 1.909676 | 1.865101 | 1.674985 | 1.733377 | 2.859826 |
| 2 | apply+any | 10.997015 | 10.412822 | 8.727058 | 8.381165 | 8.062008 | 4.446578 |
Table: Benchmarking of rowAnys(), apply+any() and rowSums > 0() on 10x10 data (transposed). The top panel shows times in milliseconds and the bottom panel shows relative times.
| expr | min | lq | mean | median | uq | max | |
|---|---|---|---|---|---|---|---|
| 1 | rowAnys | 0.003149 | 0.0035075 | 0.0044978 | 0.0044310 | 0.0047810 | 0.019036 |
| 3 | rowSums > 0 | 0.006862 | 0.0072455 | 0.0086486 | 0.0078765 | 0.0084835 | 0.050237 |
| 2 | apply+any | 0.034071 | 0.0349290 | 0.0370099 | 0.0355310 | 0.0361085 | 0.083324 |
| expr | min | lq | mean | median | uq | max | |
|---|---|---|---|---|---|---|---|
| 1 | rowAnys | 1.000000 | 1.000000 | 1.000000 | 1.000000 | 1.000000 | 1.000000 |
| 3 | rowSums > 0 | 2.179105 | 2.065716 | 1.922851 | 1.777590 | 1.774420 | 2.639052 |
| 2 | apply+any | 10.819625 | 9.958375 | 8.228470 | 8.018732 | 7.552499 | 4.377180 |
Figure: Benchmarking of colAnys(), apply+any() and colSums > 0() on 10x10 data as well as rowAnys(), apply+any() and rowSums > 0() on the same data transposed. Outliers are displayed as crosses. Times are in milliseconds.
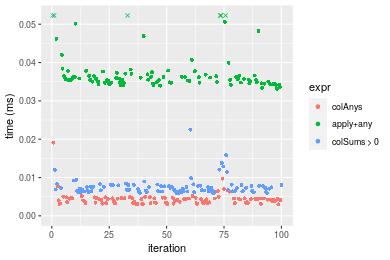
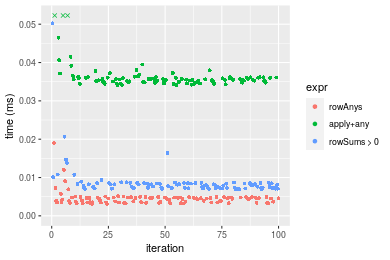 Table: Benchmarking of colAnys() and rowAnys() on 10x10 data (original and transposed). The top panel shows times in milliseconds and the bottom panel shows relative times.
| expr | min | lq | mean | median | uq | max | |
|---|---|---|---|---|---|---|---|
| 1 | colAnys | 3.015 | 3.3380 | 4.32234 | 4.2475 | 4.572 | 19.112 |
| 2 | rowAnys | 3.149 | 3.5075 | 4.49779 | 4.4310 | 4.781 | 19.036 |
| expr | min | lq | mean | median | uq | max | |
|---|---|---|---|---|---|---|---|
| 1 | colAnys | 1.000000 | 1.000000 | 1.000000 | 1.000000 | 1.000000 | 1.0000000 |
| 2 | rowAnys | 1.044444 | 1.050779 | 1.040591 | 1.043202 | 1.045713 | 0.9960234 |
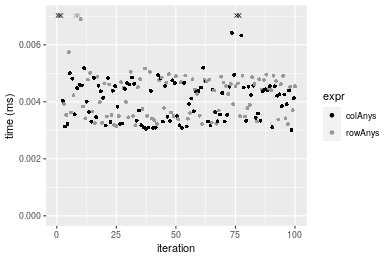
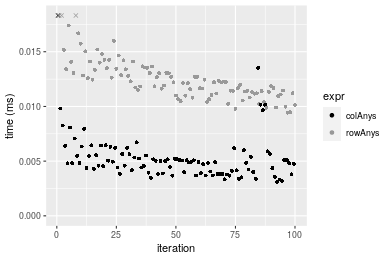
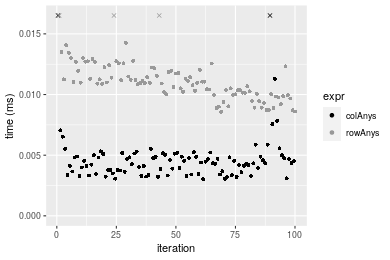
Figure: Benchmarking of colAnys() and rowAnys() on 10x10 data (original and transposed). Outliers are displayed as crosses. Times are in milliseconds.
100x100 matrix
> X <- data[["100x100"]]
> gc()
          used  (Mb) gc trigger  (Mb) max used  (Mb)
Ncells 5177209 276.5    7916910 422.9  7916910 422.9
Vcells 9309779  71.1   33191153 253.3 53339345 407.0
> colStats <- microbenchmark(colAnys = colAnys(X), `apply+any` = apply(X, MARGIN = 2L, FUN = any),
+     `colSums > 0` = (colSums(X) > 0L), unit = "ms")
> X <- t(X)
> gc()
          used  (Mb) gc trigger  (Mb) max used  (Mb)
Ncells 5177203 276.5    7916910 422.9  7916910 422.9
Vcells 9314822  71.1   33191153 253.3 53339345 407.0
> rowStats <- microbenchmark(rowAnys = rowAnys(X), `apply+any` = apply(X, MARGIN = 1L, FUN = any),
+     `rowSums > 0` = (rowSums(X) > 0L), unit = "ms")
Table: Benchmarking of colAnys(), apply+any() and colSums > 0() on 100x100 data. The top panel shows times in milliseconds and the bottom panel shows relative times.
| expr | min | lq | mean | median | uq | max | |
|---|---|---|---|---|---|---|---|
| 1 | colAnys | 0.003116 | 0.0039975 | 0.0053324 | 0.0048930 | 0.0055855 | 0.023137 |
| 3 | colSums > 0 | 0.015894 | 0.0174145 | 0.0200416 | 0.0187445 | 0.0212160 | 0.054532 |
| 2 | apply+any | 0.193797 | 0.2074970 | 0.2319392 | 0.2248080 | 0.2493780 | 0.420242 |
| expr | min | lq | mean | median | uq | max | |
|---|---|---|---|---|---|---|---|
| 1 | colAnys | 1.00000 | 1.000000 | 1.000000 | 1.000000 | 1.000000 | 1.000000 |
| 3 | colSums > 0 | 5.10077 | 4.356348 | 3.758443 | 3.830881 | 3.798407 | 2.356918 |
| 2 | apply+any | 62.19416 | 51.906692 | 43.496134 | 45.944819 | 44.647391 | 18.163202 |
Table: Benchmarking of rowAnys(), apply+any() and rowSums > 0() on 100x100 data (transposed). The top panel shows times in milliseconds and the bottom panel shows relative times.
| expr | min | lq | mean | median | uq | max | |
|---|---|---|---|---|---|---|---|
| 1 | rowAnys | 0.009437 | 0.0112045 | 0.0127247 | 0.012203 | 0.0134225 | 0.035027 |
| 3 | rowSums > 0 | 0.046317 | 0.0480945 | 0.0542597 | 0.053143 | 0.0585380 | 0.124492 |
| 2 | apply+any | 0.193635 | 0.2000855 | 0.2295396 | 0.218877 | 0.2494360 | 0.410195 |
| expr | min | lq | mean | median | uq | max | |
|---|---|---|---|---|---|---|---|
| 1 | rowAnys | 1.000000 | 1.000000 | 1.000000 | 1.000000 | 1.000000 | 1.000000 |
| 3 | rowSums > 0 | 4.908022 | 4.292427 | 4.264129 | 4.354913 | 4.361185 | 3.554172 |
| 2 | apply+any | 20.518703 | 17.857602 | 18.038933 | 17.936327 | 18.583423 | 11.710823 |
Figure: Benchmarking of colAnys(), apply+any() and colSums > 0() on 100x100 data as well as rowAnys(), apply+any() and rowSums > 0() on the same data transposed. Outliers are displayed as crosses. Times are in milliseconds.
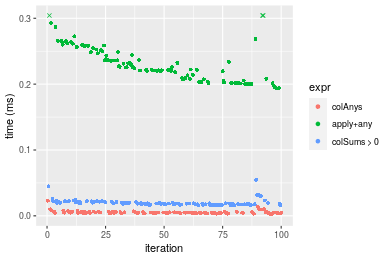
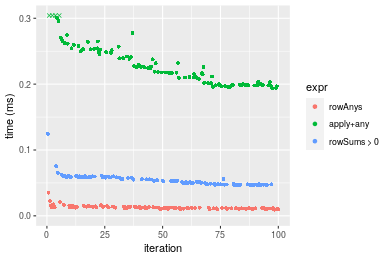 Table: Benchmarking of colAnys() and rowAnys() on 100x100 data (original and transposed). The top panel shows times in milliseconds and the bottom panel shows relative times.
| expr | min | lq | mean | median | uq | max | |
|---|---|---|---|---|---|---|---|
| 1 | colAnys | 3.116 | 3.9975 | 5.33241 | 4.893 | 5.5855 | 23.137 |
| 2 | rowAnys | 9.437 | 11.2045 | 12.72468 | 12.203 | 13.4225 | 35.027 |
| expr | min | lq | mean | median | uq | max | |
|---|---|---|---|---|---|---|---|
| 1 | colAnys | 1.000000 | 1.000000 | 1.000000 | 1.000000 | 1.000000 | 1.000000 |
| 2 | rowAnys | 3.028562 | 2.802877 | 2.386291 | 2.493971 | 2.403097 | 1.513896 |
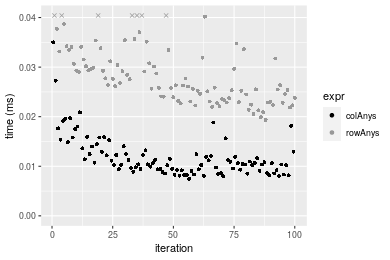
Figure: Benchmarking of colAnys() and rowAnys() on 100x100 data (original and transposed). Outliers are displayed as crosses. Times are in milliseconds.
1000x10 matrix
> X <- data[["1000x10"]]
> gc()
          used  (Mb) gc trigger  (Mb) max used  (Mb)
Ncells 5177959 276.6    7916910 422.9  7916910 422.9
Vcells 9313300  71.1   33191153 253.3 53339345 407.0
> colStats <- microbenchmark(colAnys = colAnys(X), `apply+any` = apply(X, MARGIN = 2L, FUN = any),
+     `colSums > 0` = (colSums(X) > 0L), unit = "ms")
> X <- t(X)
> gc()
          used  (Mb) gc trigger  (Mb) max used  (Mb)
Ncells 5177953 276.6    7916910 422.9  7916910 422.9
Vcells 9318343  71.1   33191153 253.3 53339345 407.0
> rowStats <- microbenchmark(rowAnys = rowAnys(X), `apply+any` = apply(X, MARGIN = 1L, FUN = any),
+     `rowSums > 0` = (rowSums(X) > 0L), unit = "ms")
Table: Benchmarking of colAnys(), apply+any() and colSums > 0() on 1000x10 data. The top panel shows times in milliseconds and the bottom panel shows relative times.
| expr | min | lq | mean | median | uq | max | |
|---|---|---|---|---|---|---|---|
| 1 | colAnys | 0.003017 | 0.003642 | 0.0047623 | 0.0043505 | 0.0049420 | 0.022187 |
| 3 | colSums > 0 | 0.017179 | 0.019061 | 0.0204056 | 0.0196370 | 0.0209315 | 0.037863 |
| 2 | apply+any | 0.111874 | 0.117432 | 0.1270182 | 0.1254865 | 0.1305995 | 0.207890 |
| expr | min | lq | mean | median | uq | max | |
|---|---|---|---|---|---|---|---|
| 1 | colAnys | 1.000000 | 1.000000 | 1.000000 | 1.000000 | 1.000000 | 1.000000 |
| 3 | colSums > 0 | 5.694067 | 5.233663 | 4.284792 | 4.513734 | 4.235431 | 1.706540 |
| 2 | apply+any | 37.081207 | 32.243822 | 26.671505 | 28.844156 | 26.426447 | 9.369901 |
Table: Benchmarking of rowAnys(), apply+any() and rowSums > 0() on 1000x10 data (transposed). The top panel shows times in milliseconds and the bottom panel shows relative times.
| expr | min | lq | mean | median | uq | max | |
|---|---|---|---|---|---|---|---|
| 1 | rowAnys | 0.008582 | 0.0100280 | 0.0113144 | 0.0109640 | 0.0119975 | 0.027385 |
| 2 | apply+any | 0.096734 | 0.1010950 | 0.1140153 | 0.1101305 | 0.1276375 | 0.198634 |
| 3 | rowSums > 0 | 0.167370 | 0.1747045 | 0.1910449 | 0.1875660 | 0.2097510 | 0.229876 |
| expr | min | lq | mean | median | uq | max | |
|---|---|---|---|---|---|---|---|
| 1 | rowAnys | 1.00000 | 1.00000 | 1.00000 | 1.00000 | 1.00000 | 1.000000 |
| 2 | apply+any | 11.27173 | 10.08127 | 10.07703 | 10.04474 | 10.63867 | 7.253387 |
| 3 | rowSums > 0 | 19.50245 | 17.42167 | 16.88514 | 17.10744 | 17.48289 | 8.394230 |
Figure: Benchmarking of colAnys(), apply+any() and colSums > 0() on 1000x10 data as well as rowAnys(), apply+any() and rowSums > 0() on the same data transposed. Outliers are displayed as crosses. Times are in milliseconds.
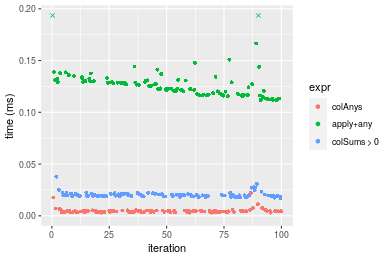
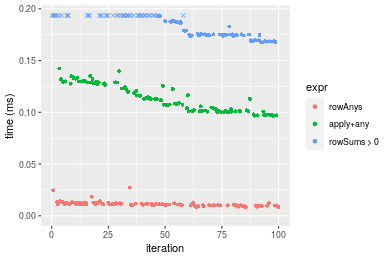 Table: Benchmarking of colAnys() and rowAnys() on 1000x10 data (original and transposed). The top panel shows times in milliseconds and the bottom panel shows relative times.
| expr | min | lq | mean | median | uq | max | |
|---|---|---|---|---|---|---|---|
| 1 | colAnys | 3.017 | 3.642 | 4.76232 | 4.3505 | 4.9420 | 22.187 |
| 2 | rowAnys | 8.582 | 10.028 | 11.31438 | 10.9640 | 11.9975 | 27.385 |
| expr | min | lq | mean | median | uq | max | |
|---|---|---|---|---|---|---|---|
| 1 | colAnys | 1.000000 | 1.000000 | 1.000000 | 1.00000 | 1.000000 | 1.000000 |
| 2 | rowAnys | 2.844548 | 2.753432 | 2.375813 | 2.52017 | 2.427661 | 1.234281 |
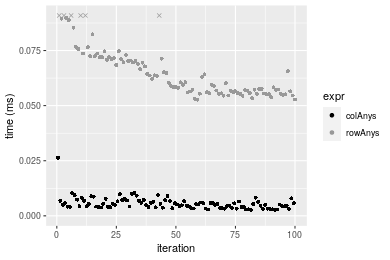
Figure: Benchmarking of colAnys() and rowAnys() on 1000x10 data (original and transposed). Outliers are displayed as crosses. Times are in milliseconds.
10x1000 matrix
> X <- data[["10x1000"]]
> gc()
          used  (Mb) gc trigger  (Mb) max used  (Mb)
Ncells 5178173 276.6    7916910 422.9  7916910 422.9
Vcells 9314049  71.1   33191153 253.3 53339345 407.0
> colStats <- microbenchmark(colAnys = colAnys(X), `apply+any` = apply(X, MARGIN = 2L, FUN = any),
+     `colSums > 0` = (colSums(X) > 0L), unit = "ms")
> X <- t(X)
> gc()
          used  (Mb) gc trigger  (Mb) max used  (Mb)
Ncells 5178167 276.6    7916910 422.9  7916910 422.9
Vcells 9319092  71.1   33191153 253.3 53339345 407.0
> rowStats <- microbenchmark(rowAnys = rowAnys(X), `apply+any` = apply(X, MARGIN = 1L, FUN = any),
+     `rowSums > 0` = (rowSums(X) > 0L), unit = "ms")
Table: Benchmarking of colAnys(), apply+any() and colSums > 0() on 10x1000 data. The top panel shows times in milliseconds and the bottom panel shows relative times.
| expr | min | lq | mean | median | uq | max | |
|---|---|---|---|---|---|---|---|
| 1 | colAnys | 0.007453 | 0.0092850 | 0.0118857 | 0.0106215 | 0.0129310 | 0.034985 |
| 3 | colSums > 0 | 0.013042 | 0.0147795 | 0.0171880 | 0.0161970 | 0.0188685 | 0.039224 |
| 2 | apply+any | 0.851302 | 0.8912870 | 1.0151367 | 0.9475960 | 1.1103635 | 1.456249 |
| expr | min | lq | mean | median | uq | max | |
|---|---|---|---|---|---|---|---|
| 1 | colAnys | 1.000000 | 1.000000 | 1.000000 | 1.000000 | 1.000000 | 1.000000 |
| 3 | colSums > 0 | 1.749899 | 1.591761 | 1.446111 | 1.524926 | 1.459168 | 1.121166 |
| 2 | apply+any | 114.222729 | 95.992138 | 85.408528 | 89.214894 | 85.868340 | 41.624954 |
Table: Benchmarking of rowAnys(), apply+any() and rowSums > 0() on 10x1000 data (transposed). The top panel shows times in milliseconds and the bottom panel shows relative times.
| expr | min | lq | mean | median | uq | max | |
|---|---|---|---|---|---|---|---|
| 1 | rowAnys | 0.019350 | 0.0236435 | 0.0290122 | 0.0263760 | 0.0318340 | 0.068443 |
| 3 | rowSums > 0 | 0.028014 | 0.0312395 | 0.0377033 | 0.0352885 | 0.0407545 | 0.124822 |
| 2 | apply+any | 0.847844 | 0.9052355 | 1.0829320 | 1.0152130 | 1.1993540 | 1.783223 |
| expr | min | lq | mean | median | uq | max | |
|---|---|---|---|---|---|---|---|
| 1 | rowAnys | 1.000000 | 1.000000 | 1.000000 | 1.000000 | 1.000000 | 1.000000 |
| 3 | rowSums > 0 | 1.447752 | 1.321272 | 1.299569 | 1.337902 | 1.280219 | 1.823737 |
| 2 | apply+any | 43.816227 | 38.286865 | 37.326820 | 38.490029 | 37.675253 | 26.054133 |
Figure: Benchmarking of colAnys(), apply+any() and colSums > 0() on 10x1000 data as well as rowAnys(), apply+any() and rowSums > 0() on the same data transposed. Outliers are displayed as crosses. Times are in milliseconds.
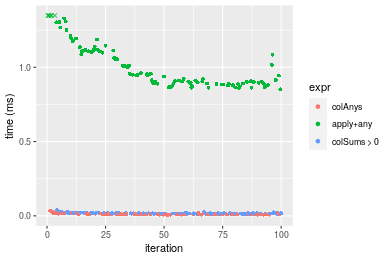
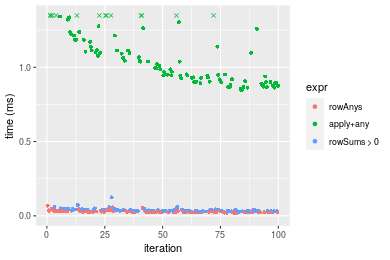 Table: Benchmarking of colAnys() and rowAnys() on 10x1000 data (original and transposed). The top panel shows times in milliseconds and the bottom panel shows relative times.
| expr | min | lq | mean | median | uq | max | |
|---|---|---|---|---|---|---|---|
| 1 | colAnys | 7.453 | 9.2850 | 11.88566 | 10.6215 | 12.931 | 34.985 |
| 2 | rowAnys | 19.350 | 23.6435 | 29.01217 | 26.3760 | 31.834 | 68.443 |
| expr | min | lq | mean | median | uq | max | |
|---|---|---|---|---|---|---|---|
| 1 | colAnys | 1.00000 | 1.000000 | 1.000000 | 1.000000 | 1.000000 | 1.000000 |
| 2 | rowAnys | 2.59627 | 2.546419 | 2.440939 | 2.483265 | 2.461836 | 1.956353 |
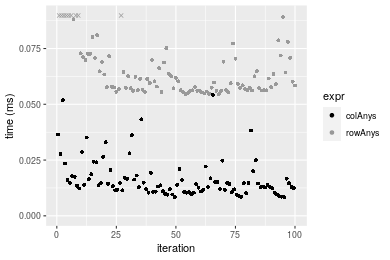
Figure: Benchmarking of colAnys() and rowAnys() on 10x1000 data (original and transposed). Outliers are displayed as crosses. Times are in milliseconds.
100x1000 matrix
> X <- data[["100x1000"]]
> gc()
          used  (Mb) gc trigger  (Mb) max used  (Mb)
Ncells 5178381 276.6    7916910 422.9  7916910 422.9
Vcells 9314568  71.1   33191153 253.3 53339345 407.0
> colStats <- microbenchmark(colAnys = colAnys(X), `apply+any` = apply(X, MARGIN = 2L, FUN = any),
+     `colSums > 0` = (colSums(X) > 0L), unit = "ms")
> X <- t(X)
> gc()
          used  (Mb) gc trigger  (Mb) max used  (Mb)
Ncells 5178369 276.6    7916910 422.9  7916910 422.9
Vcells 9364601  71.5   33191153 253.3 53339345 407.0
> rowStats <- microbenchmark(rowAnys = rowAnys(X), `apply+any` = apply(X, MARGIN = 1L, FUN = any),
+     `rowSums > 0` = (rowSums(X) > 0L), unit = "ms")
Table: Benchmarking of colAnys(), apply+any() and colSums > 0() on 100x1000 data. The top panel shows times in milliseconds and the bottom panel shows relative times.
| expr | min | lq | mean | median | uq | max | |
|---|---|---|---|---|---|---|---|
| 1 | colAnys | 0.008363 | 0.0114285 | 0.0166425 | 0.0138285 | 0.0176545 | 0.054207 |
| 3 | colSums > 0 | 0.080974 | 0.0836290 | 0.0967549 | 0.0930810 | 0.1028945 | 0.148354 |
| 2 | apply+any | 1.348433 | 1.3932855 | 1.5654713 | 1.4423025 | 1.6878120 | 2.607238 |
| expr | min | lq | mean | median | uq | max | |
|---|---|---|---|---|---|---|---|
| 1 | colAnys | 1.000000 | 1.000000 | 1.000000 | 1.000000 | 1.000000 | 1.000000 |
| 3 | colSums > 0 | 9.682411 | 7.317583 | 5.813722 | 6.731099 | 5.828231 | 2.736805 |
| 2 | apply+any | 161.237953 | 121.913243 | 94.064670 | 104.299273 | 95.602368 | 48.097810 |
Table: Benchmarking of rowAnys(), apply+any() and rowSums > 0() on 100x1000 data (transposed). The top panel shows times in milliseconds and the bottom panel shows relative times.
| expr | min | lq | mean | median | uq | max | |
|---|---|---|---|---|---|---|---|
| 1 | rowAnys | 0.054470 | 0.056363 | 0.0662752 | 0.059969 | 0.0705985 | 0.131714 |
| 3 | rowSums > 0 | 0.224264 | 0.226941 | 0.2577230 | 0.235087 | 0.2797685 | 0.415196 |
| 2 | apply+any | 1.354361 | 1.384301 | 1.5227031 | 1.418225 | 1.5867925 | 2.406700 |
| expr | min | lq | mean | median | uq | max | |
|---|---|---|---|---|---|---|---|
| 1 | rowAnys | 1.000000 | 1.000000 | 1.00000 | 1.000000 | 1.000000 | 1.000000 |
| 3 | rowSums > 0 | 4.117202 | 4.026418 | 3.88868 | 3.920142 | 3.962811 | 3.152254 |
| 2 | apply+any | 24.864347 | 24.560456 | 22.97546 | 23.649310 | 22.476292 | 18.272165 |
Figure: Benchmarking of colAnys(), apply+any() and colSums > 0() on 100x1000 data as well as rowAnys(), apply+any() and rowSums > 0() on the same data transposed. Outliers are displayed as crosses. Times are in milliseconds.
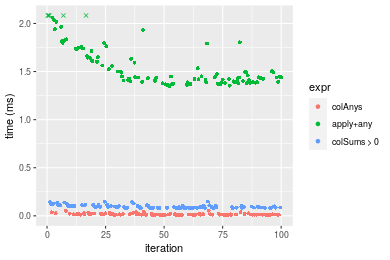
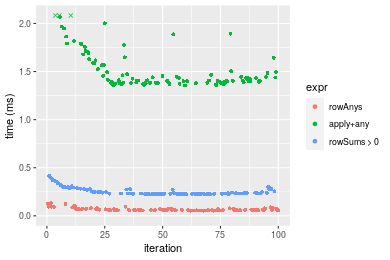 Table: Benchmarking of colAnys() and rowAnys() on 100x1000 data (original and transposed). The top panel shows times in milliseconds and the bottom panel shows relative times.
| expr | min | lq | mean | median | uq | max | |
|---|---|---|---|---|---|---|---|
| 1 | colAnys | 8.363 | 11.4285 | 16.6425 | 13.8285 | 17.6545 | 54.207 |
| 2 | rowAnys | 54.470 | 56.3630 | 66.2752 | 59.9690 | 70.5985 | 131.714 |
| expr | min | lq | mean | median | uq | max | |
|---|---|---|---|---|---|---|---|
| 1 | colAnys | 1.000000 | 1.000000 | 1.000000 | 1.000000 | 1.000000 | 1.000000 |
| 2 | rowAnys | 6.513213 | 4.931793 | 3.982286 | 4.336624 | 3.998896 | 2.429834 |
Figure: Benchmarking of colAnys() and rowAnys() on 100x1000 data (original and transposed). Outliers are displayed as crosses. Times are in milliseconds.
1000x100 matrix
> X <- data[["1000x100"]]
> gc()
          used  (Mb) gc trigger  (Mb) max used  (Mb)
Ncells 5178587 276.6    7916910 422.9  7916910 422.9
Vcells 9315221  71.1   33191153 253.3 53339345 407.0
> colStats <- microbenchmark(colAnys = colAnys(X), `apply+any` = apply(X, MARGIN = 2L, FUN = any),
+     `colSums > 0` = (colSums(X) > 0L), unit = "ms")
> X <- t(X)
> gc()
          used  (Mb) gc trigger  (Mb) max used  (Mb)
Ncells 5178575 276.6    7916910 422.9  7916910 422.9
Vcells 9365254  71.5   33191153 253.3 53339345 407.0
> rowStats <- microbenchmark(rowAnys = rowAnys(X), `apply+any` = apply(X, MARGIN = 1L, FUN = any),
+     `rowSums > 0` = (rowSums(X) > 0L), unit = "ms")
Table: Benchmarking of colAnys(), apply+any() and colSums > 0() on 1000x100 data. The top panel shows times in milliseconds and the bottom panel shows relative times.
| expr | min | lq | mean | median | uq | max | |
|---|---|---|---|---|---|---|---|
| 1 | colAnys | 0.002769 | 0.0039285 | 0.0056187 | 0.0050880 | 0.0066740 | 0.026367 |
| 3 | colSums > 0 | 0.082616 | 0.0849765 | 0.1018653 | 0.0940155 | 0.1148010 | 0.167160 |
| 2 | apply+any | 0.624251 | 0.6449835 | 0.7633539 | 0.7123450 | 0.8540075 | 1.186777 |
| expr | min | lq | mean | median | uq | max | |
|---|---|---|---|---|---|---|---|
| 1 | colAnys | 1.00000 | 1.00000 | 1.00000 | 1.00000 | 1.00000 | 1.000000 |
| 3 | colSums > 0 | 29.83604 | 21.63078 | 18.12979 | 18.47789 | 17.20123 | 6.339743 |
| 2 | apply+any | 225.44276 | 164.18060 | 135.86026 | 140.00491 | 127.96037 | 45.009937 |
Table: Benchmarking of rowAnys(), apply+any() and rowSums > 0() on 1000x100 data (transposed). The top panel shows times in milliseconds and the bottom panel shows relative times.
| expr | min | lq | mean | median | uq | max | |
|---|---|---|---|---|---|---|---|
| 1 | rowAnys | 0.052694 | 0.0560710 | 0.0656955 | 0.0606060 | 0.0714685 | 0.114980 |
| 3 | rowSums > 0 | 0.324020 | 0.3257205 | 0.3804144 | 0.3626460 | 0.4216195 | 0.541018 |
| 2 | apply+any | 0.630176 | 0.6376395 | 0.7300979 | 0.6797115 | 0.7868810 | 1.176739 |
| expr | min | lq | mean | median | uq | max | |
|---|---|---|---|---|---|---|---|
| 1 | rowAnys | 1.000000 | 1.000000 | 1.000000 | 1.000000 | 1.000000 | 1.000000 |
| 3 | rowSums > 0 | 6.149087 | 5.809072 | 5.790572 | 5.983665 | 5.899375 | 4.705323 |
| 2 | apply+any | 11.959160 | 11.372002 | 11.113366 | 11.215251 | 11.010179 | 10.234293 |
Figure: Benchmarking of colAnys(), apply+any() and colSums > 0() on 1000x100 data as well as rowAnys(), apply+any() and rowSums > 0() on the same data transposed. Outliers are displayed as crosses. Times are in milliseconds.
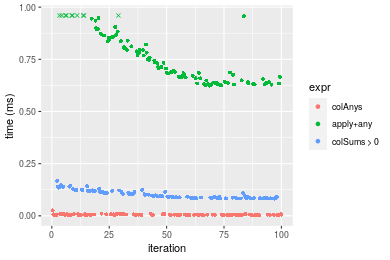
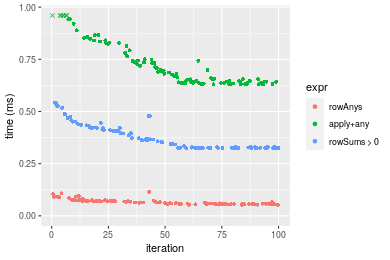 Table: Benchmarking of colAnys() and rowAnys() on 1000x100 data (original and transposed). The top panel shows times in milliseconds and the bottom panel shows relative times.
| expr | min | lq | mean | median | uq | max | |
|---|---|---|---|---|---|---|---|
| 1 | colAnys | 2.769 | 3.9285 | 5.61867 | 5.088 | 6.6740 | 26.367 |
| 2 | rowAnys | 52.694 | 56.0710 | 65.69548 | 60.606 | 71.4685 | 114.980 |
| expr | min | lq | mean | median | uq | max | |
|---|---|---|---|---|---|---|---|
| 1 | colAnys | 1.00000 | 1.00000 | 1.00000 | 1.00000 | 1.0000 | 1.000000 |
| 2 | rowAnys | 19.02997 | 14.27288 | 11.69235 | 11.91156 | 10.7085 | 4.360754 |
Figure: Benchmarking of colAnys() and rowAnys() on 1000x100 data (original and transposed). Outliers are displayed as crosses. Times are in milliseconds.
Appendix
Session information
R version 4.1.1 Patched (2021-08-10 r80727)
Platform: x86_64-pc-linux-gnu (64-bit)
Running under: Ubuntu 18.04.5 LTS

Matrix products: default
BLAS:   /home/hb/software/R-devel/R-4-1-branch/lib/R/lib/libRblas.so
LAPACK: /home/hb/software/R-devel/R-4-1-branch/lib/R/lib/libRlapack.so

locale:
 [1] LC_CTYPE=en_US.UTF-8       LC_NUMERIC=C
 [3] LC_TIME=en_US.UTF-8        LC_COLLATE=en_US.UTF-8
 [5] LC_MONETARY=en_US.UTF-8    LC_MESSAGES=en_US.UTF-8
 [7] LC_PAPER=en_US.UTF-8       LC_NAME=C
 [9] LC_ADDRESS=C               LC_TELEPHONE=C
[11] LC_MEASUREMENT=en_US.UTF-8 LC_IDENTIFICATION=C

attached base packages:
[1] stats     graphics  grDevices utils     datasets  methods   base

other attached packages:
[1] microbenchmark_1.4-7   matrixStats_0.60.0     ggplot2_3.3.5
[4] knitr_1.33             R.devices_2.17.0       R.utils_2.10.1
[7] R.oo_1.24.0            R.methodsS3_1.8.1-9001 history_0.0.1-9000

loaded via a namespace (and not attached):
 [1] Biobase_2.52.0          httr_1.4.2              splines_4.1.1
 [4] bit64_4.0.5             network_1.17.1          assertthat_0.2.1
 [7] highr_0.9               stats4_4.1.1            blob_1.2.2
[10] GenomeInfoDbData_1.2.6  robustbase_0.93-8       pillar_1.6.2
[13] RSQLite_2.2.8           lattice_0.20-44         glue_1.4.2
[16] digest_0.6.27           XVector_0.32.0          colorspace_2.0-2
[19] Matrix_1.3-4            XML_3.99-0.7            pkgconfig_2.0.3
[22] zlibbioc_1.38.0         genefilter_1.74.0       purrr_0.3.4
[25] ergm_4.1.2              xtable_1.8-4            scales_1.1.1
[28] tibble_3.1.4            annotate_1.70.0         KEGGREST_1.32.0
[31] farver_2.1.0            generics_0.1.0          IRanges_2.26.0
[34] ellipsis_0.3.2          cachem_1.0.6            withr_2.4.2
[37] BiocGenerics_0.38.0     mime_0.11               survival_3.2-13
[40] magrittr_2.0.1          crayon_1.4.1            statnet.common_4.5.0
[43] memoise_2.0.0           laeken_0.5.1            fansi_0.5.0
[46] R.cache_0.15.0          MASS_7.3-54             R.rsp_0.44.0
[49] progressr_0.8.0         tools_4.1.1             lifecycle_1.0.0
[52] S4Vectors_0.30.0        trust_0.1-8             munsell_0.5.0
[55] tabby_0.0.1-9001        AnnotationDbi_1.54.1    Biostrings_2.60.2
[58] compiler_4.1.1          GenomeInfoDb_1.28.1     rlang_0.4.11
[61] grid_4.1.1              RCurl_1.98-1.4          cwhmisc_6.6
[64] rstudioapi_0.13         rappdirs_0.3.3          startup_0.15.0
[67] labeling_0.4.2          bitops_1.0-7            base64enc_0.1-3
[70] boot_1.3-28             gtable_0.3.0            DBI_1.1.1
[73] markdown_1.1            R6_2.5.1                lpSolveAPI_5.5.2.0-17.7
[76] rle_0.9.2               dplyr_1.0.7             fastmap_1.1.0
[79] bit_4.0.4               utf8_1.2.2              parallel_4.1.1
[82] Rcpp_1.0.7              vctrs_0.3.8             png_0.1-7
[85] DEoptimR_1.0-9          tidyselect_1.1.1        xfun_0.25
[88] coda_0.19-4
Total processing time was 12.11 secs.
Reproducibility
To reproduce this report, do:
html <- matrixStats:::benchmark('colAnys')
Copyright Henrik Bengtsson. Last updated on 2021-08-25 22:11:25 (+0200 UTC). Powered by RSP.