matrixStats.benchmarks
binCounts() benchmarks
This report benchmark the performance of binCounts() against alternative methods.
Alternative methods
- hist()
as below
> hist <- graphics::hist
> binCounts_hist <- function(x, bx, right = FALSE, ...) {
+     hist(x, breaks = bx, right = right, include.lowest = TRUE, plot = FALSE)$counts
+ }
Data type “integer”
Non-sorted simulated data
> set.seed(48879)
> nx <- 1e+05
> xmax <- 0.01 * nx
> x <- runif(nx, min = 0, max = xmax)
> storage.mode(x) <- mode
> str(x)
 int [1:100000] 722 285 591 3 349 509 216 91 150 383 ...
> nb <- 10000
> bx <- seq(from = 0, to = xmax, length.out = nb + 1L)
> bx <- c(-1, bx, xmax + 1)
Results
> gc()
          used  (Mb) gc trigger  (Mb) max used  (Mb)
Ncells 5164682 275.9    7916910 422.9  7916910 422.9
Vcells 9240731  70.6   33191153 253.3 53339345 407.0
> stats <- microbenchmark(binCounts = binCounts(x, bx = bx), hist = binCounts_hist(x, bx = bx), unit = "ms")
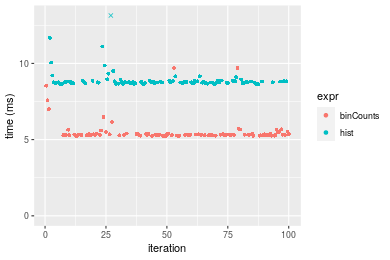
Table: Benchmarking of binCounts() and hist() on integer+unsorted data. The top panel shows times in milliseconds and the bottom panel shows relative times.
| expr | min | lq | mean | median | uq | max | |
|---|---|---|---|---|---|---|---|
| 1 | binCounts | 5.221739 | 5.291779 | 5.519676 | 5.322615 | 5.356448 | 9.70044 |
| 2 | hist | 8.632203 | 8.710278 | 8.920086 | 8.757371 | 8.827594 | 14.58375 |
| expr | min | lq | mean | median | uq | max | |
|---|---|---|---|---|---|---|---|
| 1 | binCounts | 1.000000 | 1.000000 | 1.000000 | 1.000000 | 1.000000 | 1.000000 |
| 2 | hist | 1.653128 | 1.646002 | 1.616052 | 1.645314 | 1.648031 | 1.503411 |
Figure: Benchmarking of binCounts() and hist() on integer+unsorted data. Outliers are displayed as crosses. Times are in milliseconds.
Sorted simulated data
> x <- sort(x)
> gc()
          used  (Mb) gc trigger  (Mb) max used  (Mb)
Ncells 5152060 275.2    7916910 422.9  7916910 422.9
Vcells 9057518  69.2   33191153 253.3 53339345 407.0
> stats <- microbenchmark(binCounts = binCounts(x, bx = bx), hist = binCounts_hist(x, bx = bx), unit = "ms")
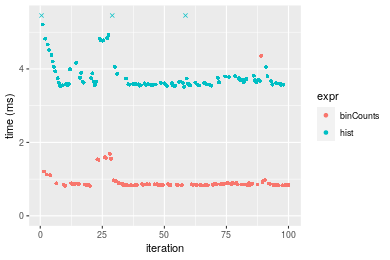
Table: Benchmarking of binCounts() and hist() on integer+sorted data. The top panel shows times in milliseconds and the bottom panel shows relative times.
| expr | min | lq | mean | median | uq | max | |
|---|---|---|---|---|---|---|---|
| 1 | binCounts | 0.818483 | 0.838998 | 0.9454563 | 0.8567175 | 0.8816355 | 4.359132 |
| 2 | hist | 3.515065 | 3.572513 | 3.8929789 | 3.6355275 | 3.8108480 | 7.925165 |
| expr | min | lq | mean | median | uq | max | |
|---|---|---|---|---|---|---|---|
| 1 | binCounts | 1.00000 | 1.000000 | 1.000000 | 1.000000 | 1.000000 | 1.00000 |
| 2 | hist | 4.29461 | 4.258071 | 4.117566 | 4.243555 | 4.322476 | 1.81806 |
Figure: Benchmarking of binCounts() and hist() on integer+sorted data. Outliers are displayed as crosses. Times are in milliseconds.
Data type “double”
Non-sorted simulated data
> set.seed(48879)
> nx <- 1e+05
> xmax <- 0.01 * nx
> x <- runif(nx, min = 0, max = xmax)
> storage.mode(x) <- mode
> str(x)
 num [1:100000] 722.11 285.54 591.33 3.42 349.14 ...
> nb <- 10000
> bx <- seq(from = 0, to = xmax, length.out = nb + 1L)
> bx <- c(-1, bx, xmax + 1)
Results
> gc()
          used  (Mb) gc trigger  (Mb) max used  (Mb)
Ncells 5152123 275.2    7916910 422.9  7916910 422.9
Vcells 9107560  69.5   33191153 253.3 53339345 407.0
> stats <- microbenchmark(binCounts = binCounts(x, bx = bx), hist = binCounts_hist(x, bx = bx), unit = "ms")
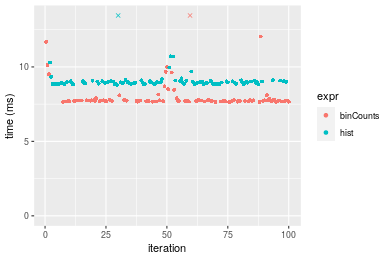
Table: Benchmarking of binCounts() and hist() on double+unsorted data. The top panel shows times in milliseconds and the bottom panel shows relative times.
| expr | min | lq | mean | median | uq | max | |
|---|---|---|---|---|---|---|---|
| 1 | binCounts | 7.638411 | 7.690463 | 8.003047 | 7.732960 | 7.758226 | 13.53363 |
| 2 | hist | 8.804883 | 8.872464 | 9.066958 | 8.953775 | 9.030924 | 13.77090 |
| expr | min | lq | mean | median | uq | max | |
|---|---|---|---|---|---|---|---|
| 1 | binCounts | 1.000000 | 1.000000 | 1.000000 | 1.000000 | 1.000000 | 1.000000 |
| 2 | hist | 1.152711 | 1.153697 | 1.132938 | 1.157872 | 1.164045 | 1.017532 |
Figure: Benchmarking of binCounts() and hist() on double+unsorted data. Outliers are displayed as crosses. Times are in milliseconds.
Sorted simulated data
> x <- sort(x)
> gc()
          used  (Mb) gc trigger  (Mb) max used  (Mb)
Ncells 5152189 275.2    7916910 422.9  7916910 422.9
Vcells 9108116  69.5   33191153 253.3 53339345 407.0
> stats <- microbenchmark(binCounts = binCounts(x, bx = bx), hist = binCounts_hist(x, bx = bx), unit = "ms")
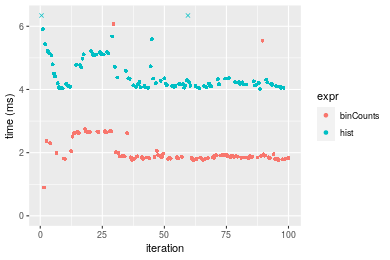
Table: Benchmarking of binCounts() and hist() on double+sorted data. The top panel shows times in milliseconds and the bottom panel shows relative times.
| expr | min | lq | mean | median | uq | max | |
|---|---|---|---|---|---|---|---|
| 1 | binCounts | 0.899685 | 1.82550 | 2.075927 | 1.878453 | 1.991132 | 6.068830 |
| 2 | hist | 4.017487 | 4.11005 | 4.483815 | 4.206721 | 4.750952 | 8.044012 |
| expr | min | lq | mean | median | uq | max | |
|---|---|---|---|---|---|---|---|
| 1 | binCounts | 1.000000 | 1.000000 | 1.000000 | 1.00000 | 1.000000 | 1.000000 |
| 2 | hist | 4.465437 | 2.251465 | 2.159909 | 2.23946 | 2.386056 | 1.325463 |
Figure: Benchmarking of binCounts() and hist() on double+sorted data. Outliers are displayed as crosses. Times are in milliseconds.
Appendix
Session information
R version 4.1.1 Patched (2021-08-10 r80727)
Platform: x86_64-pc-linux-gnu (64-bit)
Running under: Ubuntu 18.04.5 LTS

Matrix products: default
BLAS:   /home/hb/software/R-devel/R-4-1-branch/lib/R/lib/libRblas.so
LAPACK: /home/hb/software/R-devel/R-4-1-branch/lib/R/lib/libRlapack.so

locale:
 [1] LC_CTYPE=en_US.UTF-8       LC_NUMERIC=C
 [3] LC_TIME=en_US.UTF-8        LC_COLLATE=en_US.UTF-8
 [5] LC_MONETARY=en_US.UTF-8    LC_MESSAGES=en_US.UTF-8
 [7] LC_PAPER=en_US.UTF-8       LC_NAME=C
 [9] LC_ADDRESS=C               LC_TELEPHONE=C
[11] LC_MEASUREMENT=en_US.UTF-8 LC_IDENTIFICATION=C

attached base packages:
[1] stats     graphics  grDevices utils     datasets  methods   base

other attached packages:
[1] microbenchmark_1.4-7   matrixStats_0.60.0     ggplot2_3.3.5
[4] knitr_1.33             R.devices_2.17.0       R.utils_2.10.1
[7] R.oo_1.24.0            R.methodsS3_1.8.1-9001 history_0.0.1-9000

loaded via a namespace (and not attached):
 [1] Biobase_2.52.0          httr_1.4.2              splines_4.1.1
 [4] bit64_4.0.5             network_1.17.1          assertthat_0.2.1
 [7] highr_0.9               stats4_4.1.1            blob_1.2.2
[10] GenomeInfoDbData_1.2.6  robustbase_0.93-8       pillar_1.6.2
[13] RSQLite_2.2.8           lattice_0.20-44         glue_1.4.2
[16] digest_0.6.27           XVector_0.32.0          colorspace_2.0-2
[19] Matrix_1.3-4            XML_3.99-0.7            pkgconfig_2.0.3
[22] zlibbioc_1.38.0         genefilter_1.74.0       purrr_0.3.4
[25] ergm_4.1.2              xtable_1.8-4            scales_1.1.1
[28] tibble_3.1.4            annotate_1.70.0         KEGGREST_1.32.0
[31] farver_2.1.0            generics_0.1.0          IRanges_2.26.0
[34] ellipsis_0.3.2          cachem_1.0.6            withr_2.4.2
[37] BiocGenerics_0.38.0     mime_0.11               survival_3.2-13
[40] magrittr_2.0.1          crayon_1.4.1            statnet.common_4.5.0
[43] memoise_2.0.0           laeken_0.5.1            fansi_0.5.0
[46] R.cache_0.15.0          MASS_7.3-54             R.rsp_0.44.0
[49] progressr_0.8.0         tools_4.1.1             lifecycle_1.0.0
[52] S4Vectors_0.30.0        trust_0.1-8             munsell_0.5.0
[55] tabby_0.0.1-9001        AnnotationDbi_1.54.1    Biostrings_2.60.2
[58] compiler_4.1.1          GenomeInfoDb_1.28.1     rlang_0.4.11
[61] grid_4.1.1              RCurl_1.98-1.4          cwhmisc_6.6
[64] rstudioapi_0.13         rappdirs_0.3.3          startup_0.15.0
[67] labeling_0.4.2          bitops_1.0-7            base64enc_0.1-3
[70] boot_1.3-28             gtable_0.3.0            DBI_1.1.1
[73] markdown_1.1            R6_2.5.1                lpSolveAPI_5.5.2.0-17.7
[76] rle_0.9.2               dplyr_1.0.7             fastmap_1.1.0
[79] bit_4.0.4               utf8_1.2.2              parallel_4.1.1
[82] Rcpp_1.0.7              vctrs_0.3.8             png_0.1-7
[85] DEoptimR_1.0-9          tidyselect_1.1.1        xfun_0.25
[88] coda_0.19-4
Total processing time was 7.7 secs.
Reproducibility
To reproduce this report, do:
html <- matrixStats:::benchmark('binCounts')
Copyright Henrik Bengtsson. Last updated on 2021-08-25 22:09:23 (+0200 UTC). Powered by RSP.